Contents:
- Columns
- Missing Value Analysis
- Handling Missing Values
- Unique Values
- Univariate Analysis
- Bivariate Analysis
- Web Scraping
import pandas as pd
import missingno as msno
import matplotlib.pyplot as plt
import seaborn as sns
Data Source: https://www.kaggle.com/c/house-prices-advanced-regression-techniques/data?select=train.csv
df = pd.read_csv('../Datasets/housing_train.csv')
df.head()
| Id | MSSubClass | MSZoning | LotFrontage | LotArea | Street | Alley | LotShape | LandContour | Utilities | ... | PoolArea | PoolQC | Fence | MiscFeature | MiscVal | MoSold | YrSold | SaleType | SaleCondition | SalePrice | |
|---|---|---|---|---|---|---|---|---|---|---|---|---|---|---|---|---|---|---|---|---|---|
| 0 | 1 | 60 | RL | 65.0 | 8450 | Pave | NaN | Reg | Lvl | AllPub | ... | 0 | NaN | NaN | NaN | 0 | 2 | 2008 | WD | Normal | 208500 |
| 1 | 2 | 20 | RL | 80.0 | 9600 | Pave | NaN | Reg | Lvl | AllPub | ... | 0 | NaN | NaN | NaN | 0 | 5 | 2007 | WD | Normal | 181500 |
| 2 | 3 | 60 | RL | 68.0 | 11250 | Pave | NaN | IR1 | Lvl | AllPub | ... | 0 | NaN | NaN | NaN | 0 | 9 | 2008 | WD | Normal | 223500 |
| 3 | 4 | 70 | RL | 60.0 | 9550 | Pave | NaN | IR1 | Lvl | AllPub | ... | 0 | NaN | NaN | NaN | 0 | 2 | 2006 | WD | Abnorml | 140000 |
| 4 | 5 | 60 | RL | 84.0 | 14260 | Pave | NaN | IR1 | Lvl | AllPub | ... | 0 | NaN | NaN | NaN | 0 | 12 | 2008 | WD | Normal | 250000 |
5 rows × 81 columns
df.describe()
| Id | MSSubClass | LotFrontage | LotArea | OverallQual | OverallCond | YearBuilt | YearRemodAdd | MasVnrArea | BsmtFinSF1 | ... | WoodDeckSF | OpenPorchSF | EnclosedPorch | 3SsnPorch | ScreenPorch | PoolArea | MiscVal | MoSold | YrSold | SalePrice | |
|---|---|---|---|---|---|---|---|---|---|---|---|---|---|---|---|---|---|---|---|---|---|
| count | 1460.000000 | 1460.000000 | 1201.000000 | 1460.000000 | 1460.000000 | 1460.000000 | 1460.000000 | 1460.000000 | 1452.000000 | 1460.000000 | ... | 1460.000000 | 1460.000000 | 1460.000000 | 1460.000000 | 1460.000000 | 1460.000000 | 1460.000000 | 1460.000000 | 1460.000000 | 1460.000000 |
| mean | 730.500000 | 56.897260 | 70.049958 | 10516.828082 | 6.099315 | 5.575342 | 1971.267808 | 1984.865753 | 103.685262 | 443.639726 | ... | 94.244521 | 46.660274 | 21.954110 | 3.409589 | 15.060959 | 2.758904 | 43.489041 | 6.321918 | 2007.815753 | 180921.195890 |
| std | 421.610009 | 42.300571 | 24.284752 | 9981.264932 | 1.382997 | 1.112799 | 30.202904 | 20.645407 | 181.066207 | 456.098091 | ... | 125.338794 | 66.256028 | 61.119149 | 29.317331 | 55.757415 | 40.177307 | 496.123024 | 2.703626 | 1.328095 | 79442.502883 |
| min | 1.000000 | 20.000000 | 21.000000 | 1300.000000 | 1.000000 | 1.000000 | 1872.000000 | 1950.000000 | 0.000000 | 0.000000 | ... | 0.000000 | 0.000000 | 0.000000 | 0.000000 | 0.000000 | 0.000000 | 0.000000 | 1.000000 | 2006.000000 | 34900.000000 |
| 25% | 365.750000 | 20.000000 | 59.000000 | 7553.500000 | 5.000000 | 5.000000 | 1954.000000 | 1967.000000 | 0.000000 | 0.000000 | ... | 0.000000 | 0.000000 | 0.000000 | 0.000000 | 0.000000 | 0.000000 | 0.000000 | 5.000000 | 2007.000000 | 129975.000000 |
| 50% | 730.500000 | 50.000000 | 69.000000 | 9478.500000 | 6.000000 | 5.000000 | 1973.000000 | 1994.000000 | 0.000000 | 383.500000 | ... | 0.000000 | 25.000000 | 0.000000 | 0.000000 | 0.000000 | 0.000000 | 0.000000 | 6.000000 | 2008.000000 | 163000.000000 |
| 75% | 1095.250000 | 70.000000 | 80.000000 | 11601.500000 | 7.000000 | 6.000000 | 2000.000000 | 2004.000000 | 166.000000 | 712.250000 | ... | 168.000000 | 68.000000 | 0.000000 | 0.000000 | 0.000000 | 0.000000 | 0.000000 | 8.000000 | 2009.000000 | 214000.000000 |
| max | 1460.000000 | 190.000000 | 313.000000 | 215245.000000 | 10.000000 | 9.000000 | 2010.000000 | 2010.000000 | 1600.000000 | 5644.000000 | ... | 857.000000 | 547.000000 | 552.000000 | 508.000000 | 480.000000 | 738.000000 | 15500.000000 | 12.000000 | 2010.000000 | 755000.000000 |
8 rows × 38 columns
df.info()
<class 'pandas.core.frame.DataFrame'>
RangeIndex: 1460 entries, 0 to 1459
Data columns (total 81 columns):
 #   Column         Non-Null Count  Dtype
---  ------         --------------  -----
 0   Id             1460 non-null   int64
 1   MSSubClass     1460 non-null   int64
 2   MSZoning       1460 non-null   object
 3   LotFrontage    1201 non-null   float64
 4   LotArea        1460 non-null   int64
 5   Street         1460 non-null   object
 6   Alley          91 non-null     object
 7   LotShape       1460 non-null   object
 8   LandContour    1460 non-null   object
 9   Utilities      1460 non-null   object
 10  LotConfig      1460 non-null   object
 11  LandSlope      1460 non-null   object
 12  Neighborhood   1460 non-null   object
 13  Condition1     1460 non-null   object
 14  Condition2     1460 non-null   object
 15  BldgType       1460 non-null   object
 16  HouseStyle     1460 non-null   object
 17  OverallQual    1460 non-null   int64
 18  OverallCond    1460 non-null   int64
 19  YearBuilt      1460 non-null   int64
 20  YearRemodAdd   1460 non-null   int64
 21  RoofStyle      1460 non-null   object
 22  RoofMatl       1460 non-null   object
 23  Exterior1st    1460 non-null   object
 24  Exterior2nd    1460 non-null   object
 25  MasVnrType     1452 non-null   object
 26  MasVnrArea     1452 non-null   float64
 27  ExterQual      1460 non-null   object
 28  ExterCond      1460 non-null   object
 29  Foundation     1460 non-null   object
 30  BsmtQual       1423 non-null   object
 31  BsmtCond       1423 non-null   object
 32  BsmtExposure   1422 non-null   object
 33  BsmtFinType1   1423 non-null   object
 34  BsmtFinSF1     1460 non-null   int64
 35  BsmtFinType2   1422 non-null   object
 36  BsmtFinSF2     1460 non-null   int64
 37  BsmtUnfSF      1460 non-null   int64
 38  TotalBsmtSF    1460 non-null   int64
 39  Heating        1460 non-null   object
 40  HeatingQC      1460 non-null   object
 41  CentralAir     1460 non-null   object
 42  Electrical     1459 non-null   object
 43  1stFlrSF       1460 non-null   int64
 44  2ndFlrSF       1460 non-null   int64
 45  LowQualFinSF   1460 non-null   int64
 46  GrLivArea      1460 non-null   int64
 47  BsmtFullBath   1460 non-null   int64
 48  BsmtHalfBath   1460 non-null   int64
 49  FullBath       1460 non-null   int64
 50  HalfBath       1460 non-null   int64
 51  BedroomAbvGr   1460 non-null   int64
 52  KitchenAbvGr   1460 non-null   int64
 53  KitchenQual    1460 non-null   object
 54  TotRmsAbvGrd   1460 non-null   int64
 55  Functional     1460 non-null   object
 56  Fireplaces     1460 non-null   int64
 57  FireplaceQu    770 non-null    object
 58  GarageType     1379 non-null   object
 59  GarageYrBlt    1379 non-null   float64
 60  GarageFinish   1379 non-null   object
 61  GarageCars     1460 non-null   int64
 62  GarageArea     1460 non-null   int64
 63  GarageQual     1379 non-null   object
 64  GarageCond     1379 non-null   object
 65  PavedDrive     1460 non-null   object
 66  WoodDeckSF     1460 non-null   int64
 67  OpenPorchSF    1460 non-null   int64
 68  EnclosedPorch  1460 non-null   int64
 69  3SsnPorch      1460 non-null   int64
 70  ScreenPorch    1460 non-null   int64
 71  PoolArea       1460 non-null   int64
 72  PoolQC         7 non-null      object
 73  Fence          281 non-null    object
 74  MiscFeature    54 non-null     object
 75  MiscVal        1460 non-null   int64
 76  MoSold         1460 non-null   int64
 77  YrSold         1460 non-null   int64
 78  SaleType       1460 non-null   object
 79  SaleCondition  1460 non-null   object
 80  SalePrice      1460 non-null   int64
dtypes: float64(3), int64(35), object(43)
memory usage: 924.0+ KB
Columns
df.dtypes
Id                 int64
MSSubClass         int64
MSZoning          object
LotFrontage      float64
LotArea            int64
                  ...
MoSold             int64
YrSold             int64
SaleType          object
SaleCondition     object
SalePrice          int64
Length: 81, dtype: object
numerical_cols = [cname for cname in df.columns if df[cname].dtype in ['int64', 'float64']]
print('Number of numerical columns: ', len(numerical_cols))
# numerical_cols
Number of numerical columns: 38
categorical_columns = [cname for cname in df.columns if df[cname].dtype=='object']
print('Number of categorical columns: ', len(categorical_columns))
# categorical_columns
Number of categorical columns: 43
Missing Value Analysis
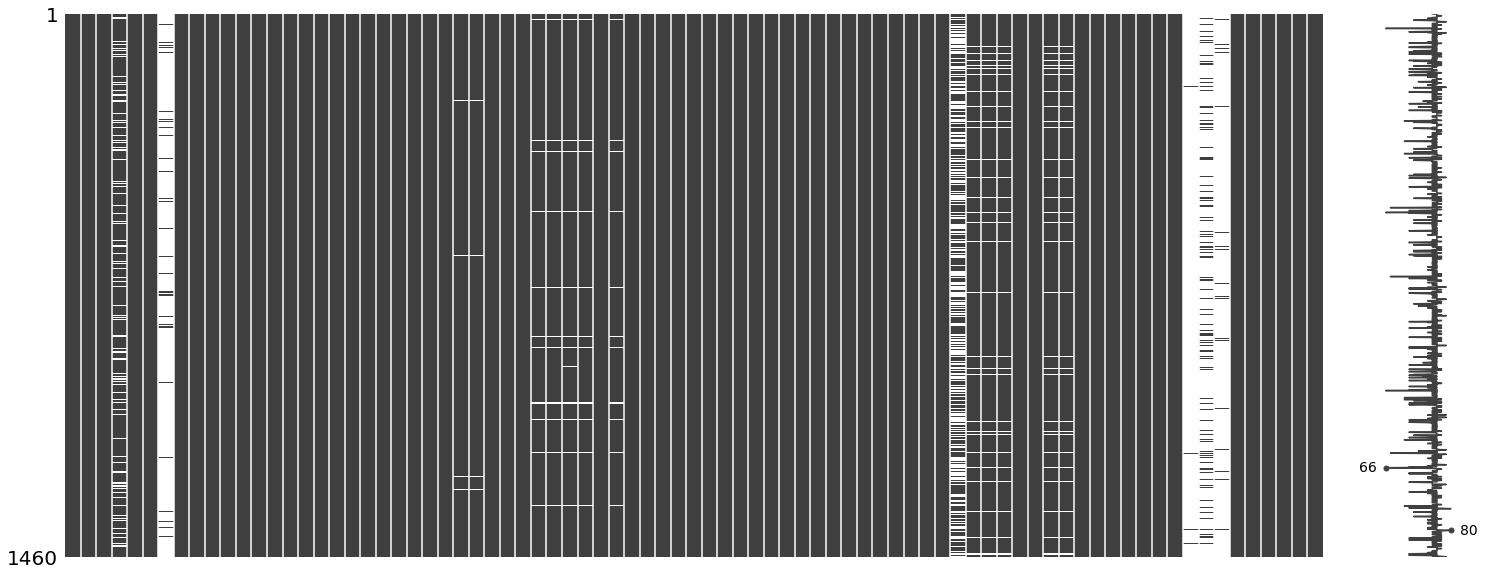
msno.matrix(df)

cols_with_missing = [col for col in df.columns if df[col].isnull().any()]
print('Columns with missing values in df: ', cols_with_missing)
Columns with missing values in df: ['LotFrontage', 'Alley', 'MasVnrType', 'MasVnrArea', 'BsmtQual', 'BsmtCond', 'BsmtExposure', 'BsmtFinType1', 'BsmtFinType2', 'Electrical', 'FireplaceQu', 'GarageType', 'GarageYrBlt', 'GarageFinish', 'GarageQual', 'GarageCond', 'PoolQC', 'Fence', 'MiscFeature']
Handling Missing Values
1. Omit Data
We filter out columns which contain more than 90% missing values.
nv1 = df.isnull().sum()
nv2 = nv1.where(nv1>0).dropna()/df.shape[0]*100
nv2.where(nv2>90).dropna()
Alley          93.767123
PoolQC         99.520548
MiscFeature    96.301370
dtype: float64
We see here PoolQC contains 99% missing values and we decide to go ahead and drop it.
cols_to_drop = ['PoolQC']

X = df.drop(cols_to_drop, axis=1)

if 'PoolQC' in X.columns:
    print('Drop Failed')
else:
    print('Drop Passed')
Drop Passed
2. Imputation
from sklearn.compose import ColumnTransformer
from sklearn.pipeline import Pipeline
from sklearn.impute import SimpleImputer
from sklearn.preprocessing import OneHotEncoder
# Preprocessing for numerical data
numerical_transformer = SimpleImputer(strategy='median')

# Preprocessing for categorical data
categorical_transformer = Pipeline(steps=[
    ('imputer', SimpleImputer(strategy='most_frequent')),
    ('onehot', OneHotEncoder(handle_unknown='ignore'))
])
# Bundle preprocessing for numerical and categorical data
preprocessor = ColumnTransformer(
    transformers=[
        ('num', numerical_transformer, numerical_cols),
        ('cat', categorical_transformer, categorical_columns)
    ])
Additional Notes on how to use these objects:
linear_reg_pipe = Pipeline(steps=[('preprocessor', preprocessor),('regressor', LinearRegression())])
linear_reg_pipe.fit(X_train, y_train)
linear_reg_preds = linear_reg_pipe.predict(X_test)
Unique Values
df[categorical_columns].nunique()
MSZoning          5
Street            2
Alley             2
LotShape          4
LandContour       4
Utilities         2
LotConfig         5
LandSlope         3
Neighborhood     25
Condition1        9
Condition2        8
BldgType          5
HouseStyle        8
RoofStyle         6
RoofMatl          8
Exterior1st      15
Exterior2nd      16
MasVnrType        4
ExterQual         4
ExterCond         5
Foundation        6
BsmtQual          4
BsmtCond          4
BsmtExposure      4
BsmtFinType1      6
BsmtFinType2      6
Heating           6
HeatingQC         5
CentralAir        2
Electrical        5
KitchenQual       4
Functional        7
FireplaceQu       5
GarageType        6
GarageFinish      3
GarageQual        5
GarageCond        5
PavedDrive        3
PoolQC            3
Fence             4
MiscFeature       4
SaleType          9
SaleCondition     6
dtype: int64
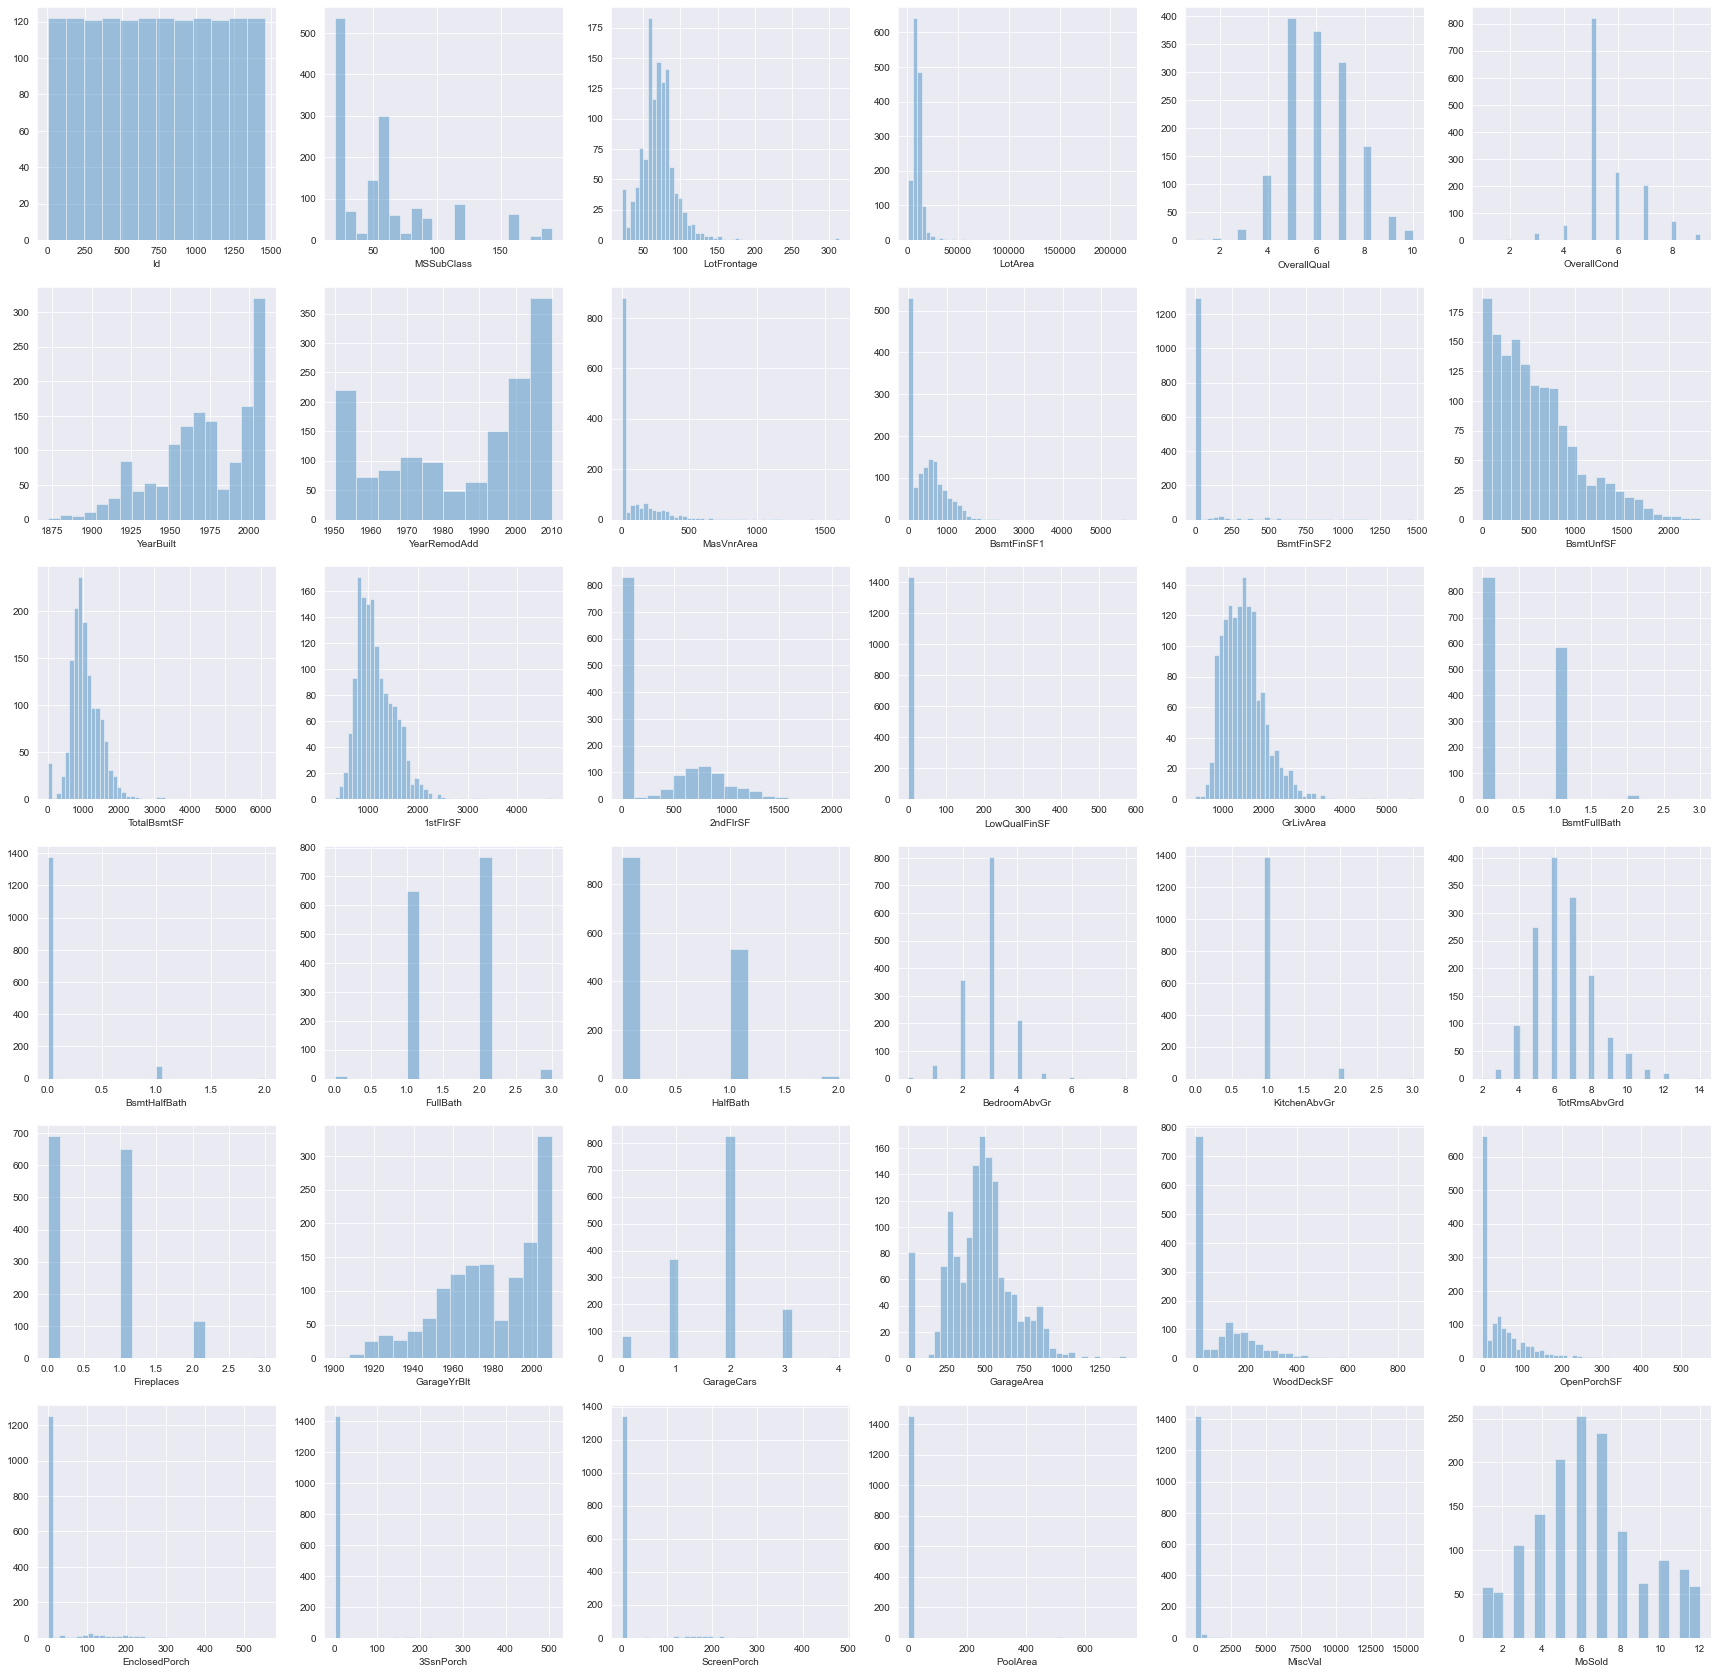
Univariate Analysis
fig, axes = plt.subplots(nrows=6, ncols=6, figsize=(30,30))
for i, col in enumerate(numerical_cols[0:-2]):
    sns.distplot(df[col], kde=False, ax=axes[i//6,i%6])

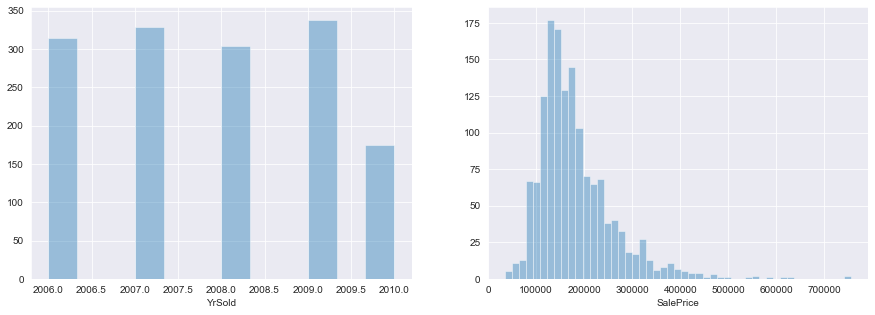
fig, axes = plt.subplots(nrows=1, ncols=2, figsize=(15,5))
for i, col in enumerate(numerical_cols[36:]):
    sns.distplot(df[col], kde=False, ax=axes[i])

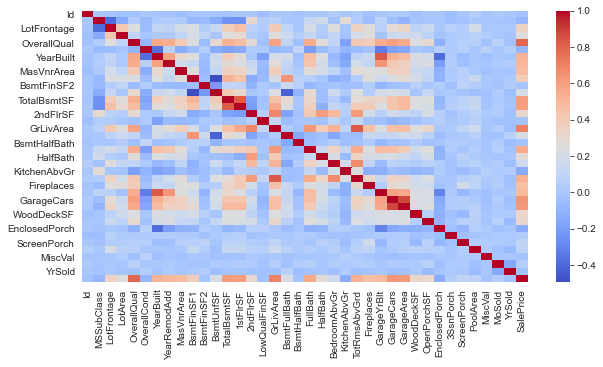
Bivariate Distribution (Heatmap)
plt.figure(figsize=(10,5))
sns.heatmap(df[numerical_cols].corr(), annot=False, cmap='coolwarm', fmt='.1f')

Web Scraping
from bs4 import BeautifulSoup
import requests
res = requests.get("https://en.wikipedia.org/wiki/List_of_postal_codes_of_Canada:_M")
soup = BeautifulSoup(res.content,'lxml')
table = soup.find_all('table')[0]
df_can = pd.read_html(str(table))
df = df_can[0]

df.columns = df.iloc[0]
df = df[1:]

df.head()
| M1A | Not assigned | Not assigned | |
|---|---|---|---|
| 1 | M2A | Not assigned | Not assigned |
| 2 | M3A | North York | Parkwoods |
| 3 | M4A | North York | Victoria Village |
| 4 | M5A | Downtown Toronto | Regent Park, Harbourfront |
| 5 | M6A | North York | Lawrence Manor, Lawrence Heights |