Binplots
Hexagonal Binplots
matplotlib
fig, axs = plt.subplots(ncols=1, sharey=True, figsize=(10, 6))
fig.subplots_adjust(hspace=0.5, left=0.07, right=0.93)
ax = axs
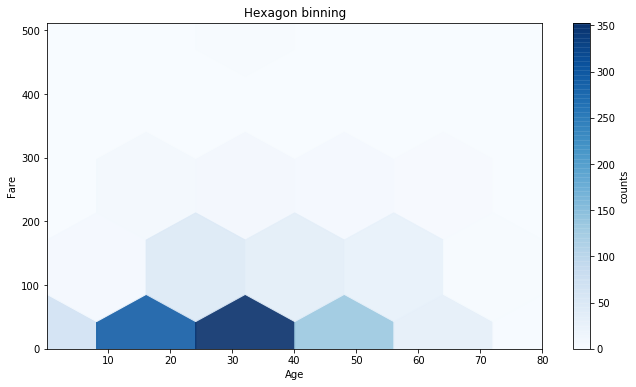
hb = ax.hexbin(df["age"], df["fare"], gridsize=5, cmap='Blues', alpha = 0.9)
ax.axis([min(df['age']), max(df['age']), min(df['fare']), max(df['fare'])])
ax.set_title("Hexagon binning")
cb = fig.colorbar(hb, ax=ax)
cb.set_label('counts')
ax.set_xlabel('Age')
ax.set_ylabel('Fare')
seaborn
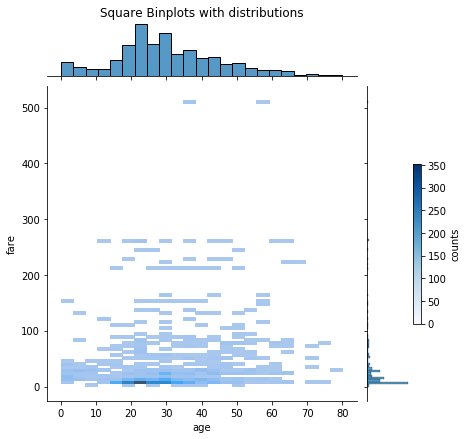
x = sns.jointplot(data=df, x="age", y="fare", kind="hist")
x.ax_joint.set_title("Square Binplots with distributions", pad=70.0)
cb = fig.colorbar(hb, ax=x.ax_marg_y)
cb.set_label('counts')
print(ax)
plt.show()
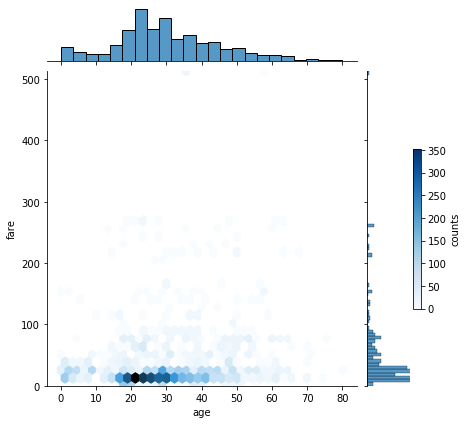
x = sns.jointplot(data=df, x="age", y="fare", kind="hex")
x.ax_marg_y.axis([min(df['age']), max(df['age']), min(df['fare']), max(df['fare'])])
cb = fig.colorbar(hb, ax=x.ax_marg_y)
cb.set_label('counts')