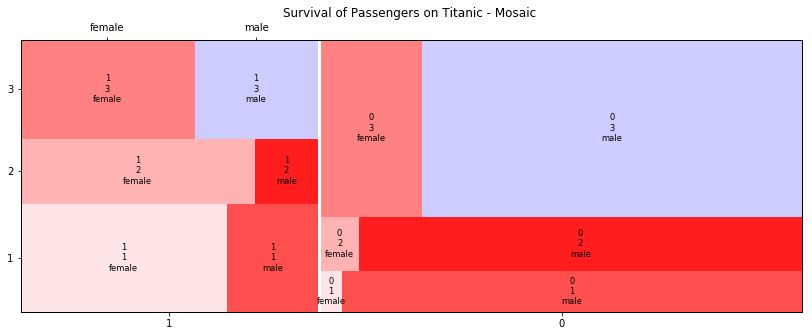
#df = pd.DataFrame({'size' : ['small', 'large', 'large', 'small', 'large', 'small', 'large', 'large'], 'length' : ['long', 'short', 'medium', 'medium', 'medium', 'short', 'long', 'medium'], 'temp' : ['cold', 'hot', 'cold', 'warm', 'warm', 'cold', 'hot', 'warm']})

props = {}
single_low = 28
max_start = 255
max_start_oth = 229
diff = 25
r,g,b=max_start,max_start_oth,max_start_oth
for x in df['sex'].unique(): #unique colums in each
    for y in df['pclass'].unique():
        col = '#{}{}{}'.format(format(int(r),'02x'),format(int(g),'02x'),format(int(b),'02x'))
        for z in df['survived'].unique():
            props[(str(z), str(y), str(x))] ={'color': col}
            if r==max_start:
                g-=diff
                b-=diff
            elif b==max_start:
                r-=diff
                g-=diff
            elif g==max_start:
                r-=diff
                b-=diff
            if (g<single_low and b<single_low):
                b,r,g=max_start,max_start_oth,max_start_oth
            elif (r<single_low and g<single_low):
                g,b,r = max_start,max_start_oth,max_start_oth
            elif (r<single_low and b<single_low):
                print("no more colors")
