Contents:
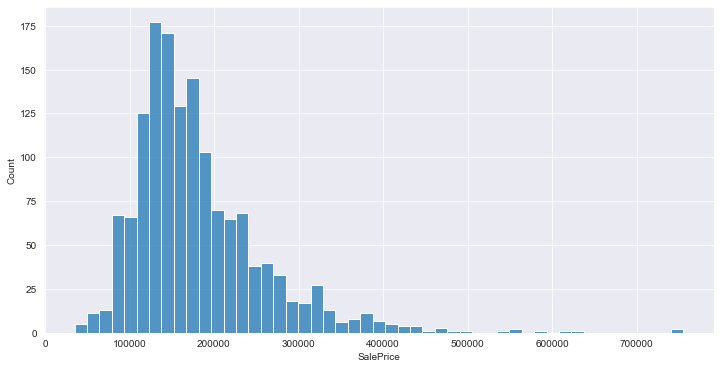
Histogram
plt.figure(figsize=(12,6))
sns.histplot(df['SalePrice'])
Line Plot
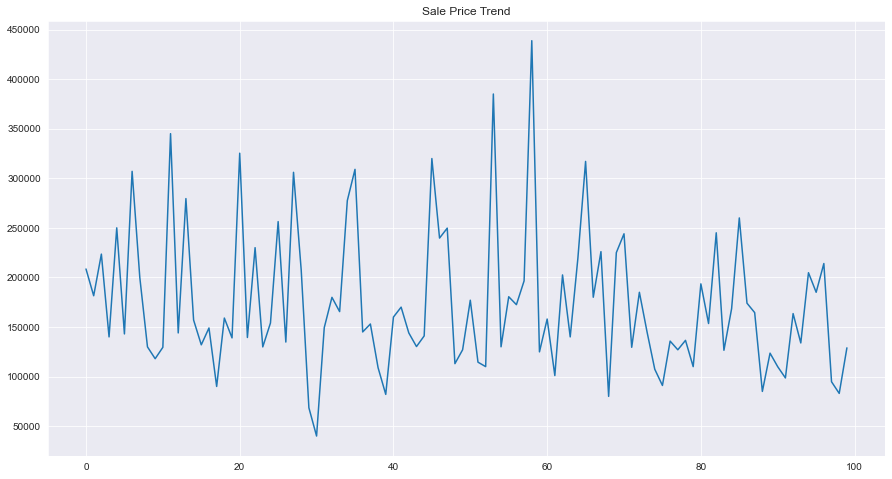
plt.figure(figsize=(15,8))
sns.lineplot(data=df[:100]['SalePrice'])
Violin Plot
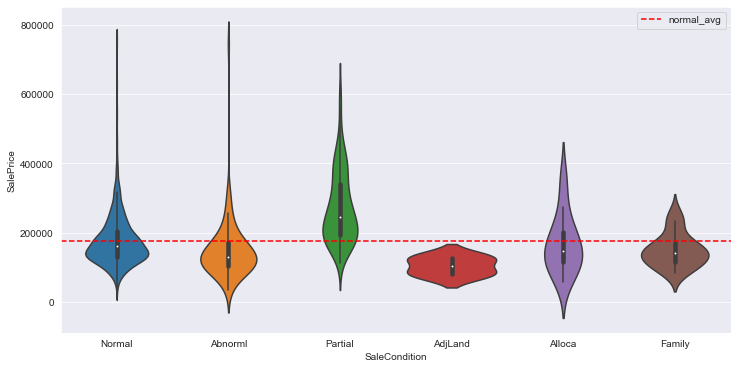
plt.figure(figsize=(12,6))
sns.violinplot(x = df['SaleCondition'], y = df['SalePrice'])
plt.axhline(df[df['SaleCondition'] == 'Normal']['SalePrice'].mean(),\
            color='r',linestyle='dashed',label='normal_avg')
plt.legend()
Box Plot
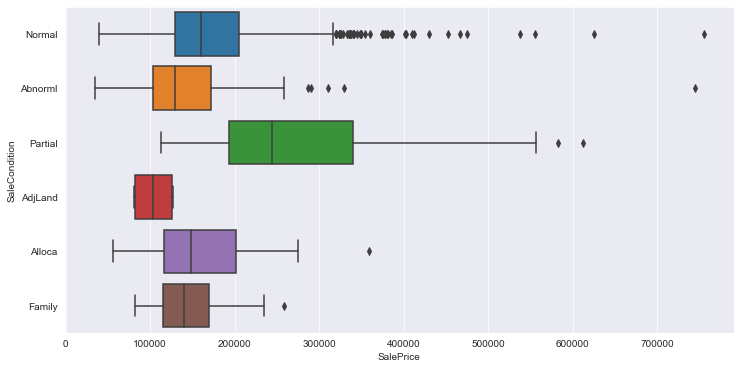
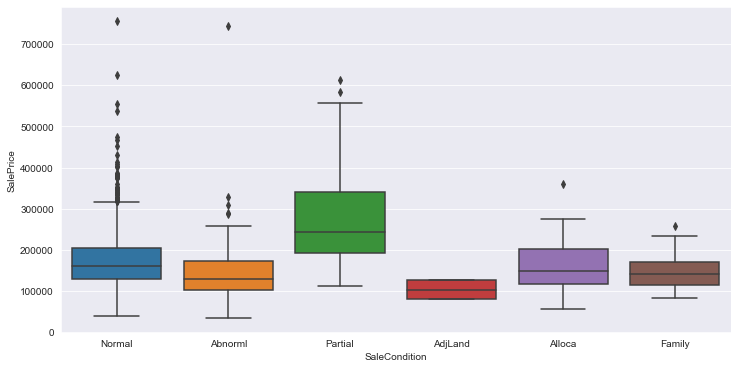
These plots are useful for outlier detection.
- Horizontal
plt.figure(figsize=(12,6))
sns.boxplot(data=df, y='SaleCondition', x='SalePrice', orient='h')
- Vertical
plt.figure(figsize=(12,6))
sns.boxplot(data=df, x='SaleCondition', y='SalePrice', orient='v')
Ridge Line Plot
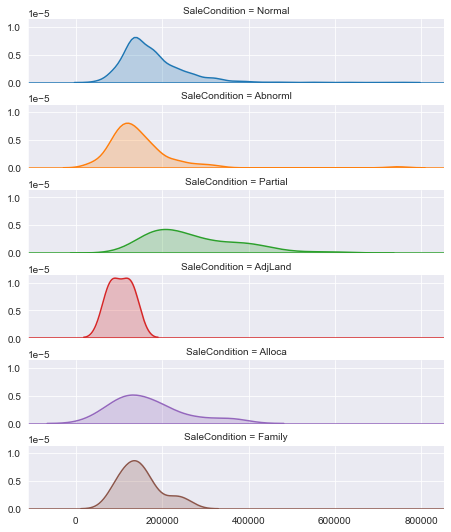
ridge_plot = sns.FacetGrid(df, row="SaleCondition", hue="SaleCondition", aspect=5, height=1.25)
ridge_plot.map(sns.kdeplot, 'SalePrice', shade=True)
ridge_plot.map(plt.axhline)
ridge_plot.fig.subplots_adjust(hspace=0.35)
QQ Plots
Source: https://seaborn-qqplot.readthedocs.io/en/latest/
from seaborn_qqplot import pplot
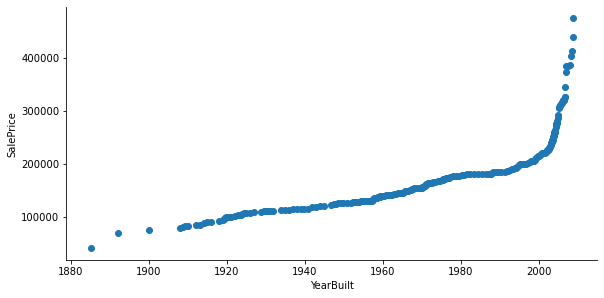
pplot(df.iloc[:250,:], x='YearBuilt', y='SalePrice', kind='qq', height=4, aspect=2)
