Spatial Data
Contents:
Folium Maps
#!conda install -c conda-forge geopy --yes
from geopy.geocoders import Nominatim # convert an address into latitude and longitude values
#!conda install -c conda-forge folium=0.5.0 --yes
import folium # map rendering library
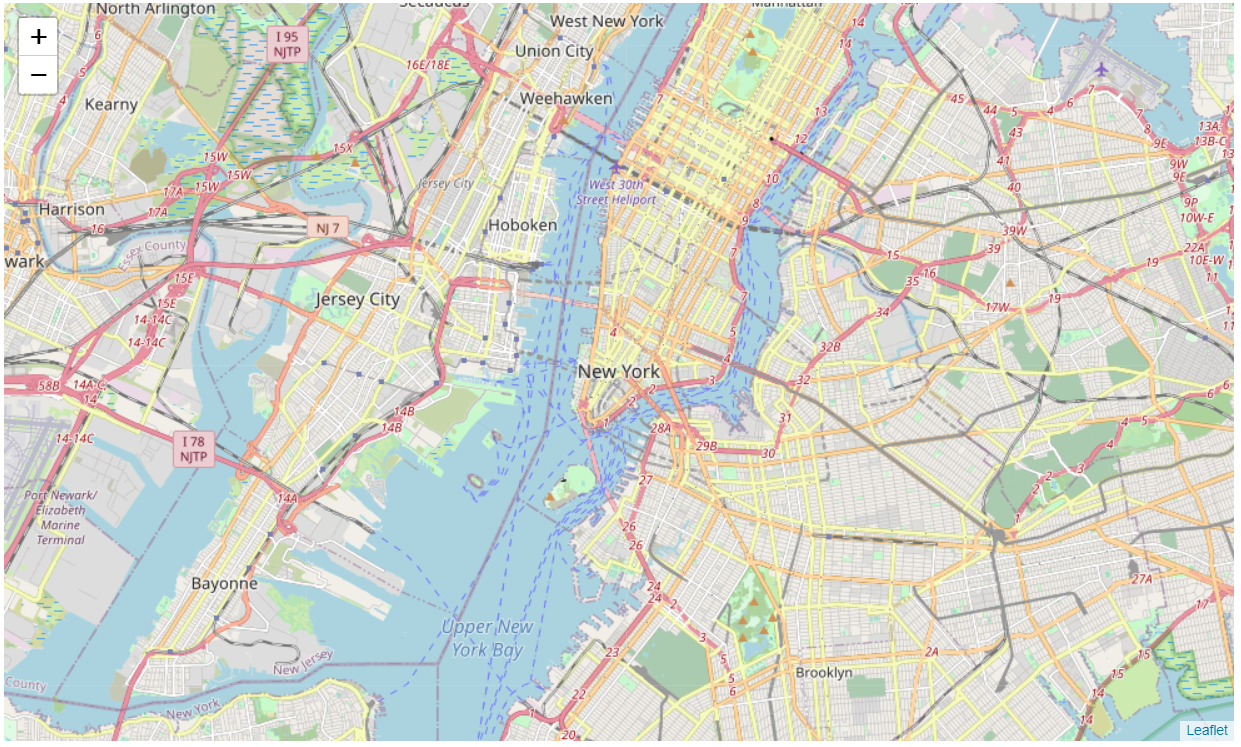
address = 'New York, USA'

geolocator = Nominatim(user_agent="nyc_explorer")
location = geolocator.geocode(address)
latitude = location.latitude
longitude = location.longitude
map_nyc = folium.Map(location=[latitude, longitude], zoom_start=12)

map_nyc
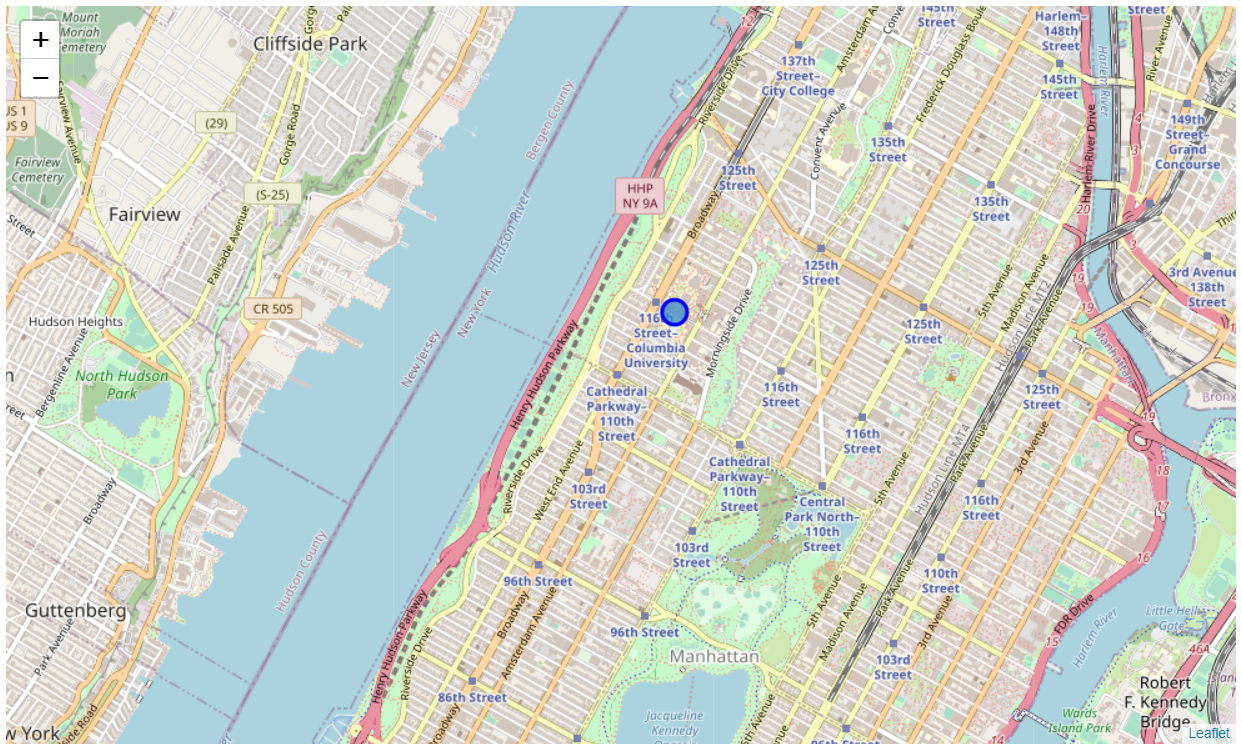
cu_lat = 40.8075
cu_lng = -73.9626
map_cu = folium.Map(location=[cu_lat, cu_lng], zoom_start=16)

folium.CircleMarker(
    [cu_lat, cu_lng],
    radius=10,
    color='blue',
    fill=True,
    fill_color='#3186cc',
    fill_opacity=0.7,
    parse_html=False).add_to(map_cu)

map_cu
Chloropleth Maps
#!conda install -c plotly plotly
import plotly.express as px
import plotly.offline as py
py.init_notebook_mode(connected=True)
df_px = px.data.election()
geojson = px.data.election_geojson()

fig = px.choropleth(df_px, geojson=geojson, color="Bergeron",
                    locations="district", featureidkey="properties.district",
                    projection="mercator"
                   )
fig.update_geos(fitbounds="locations", visible=False)
fig.update_layout(margin={"r":0,"t":0,"l":0,"b":0})
#fig.show() # Use this to render the plot in your notebook

py.plot({"data": fig}, output_type="div", show_link="False", include_plotlyjs="False", link_text="") # For HTML rendering