Sep 3, 2021 - Continuous Variables

Contents:

Histogram

[Back to top]

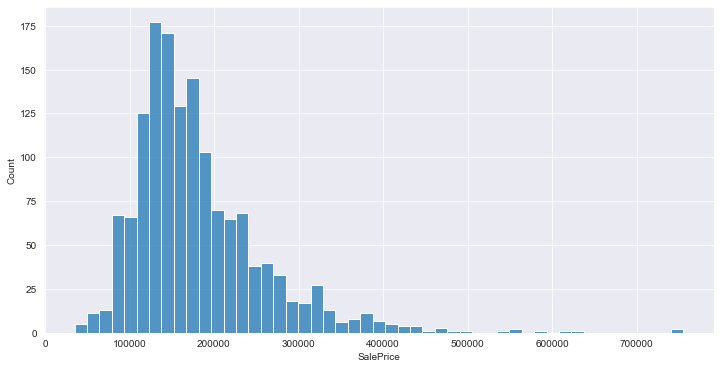
plt.figure(figsize=(12,6))
sns.histplot(df['SalePrice'])

png

Line Plot

[Back to top]

plt.figure(figsize=(15,8))
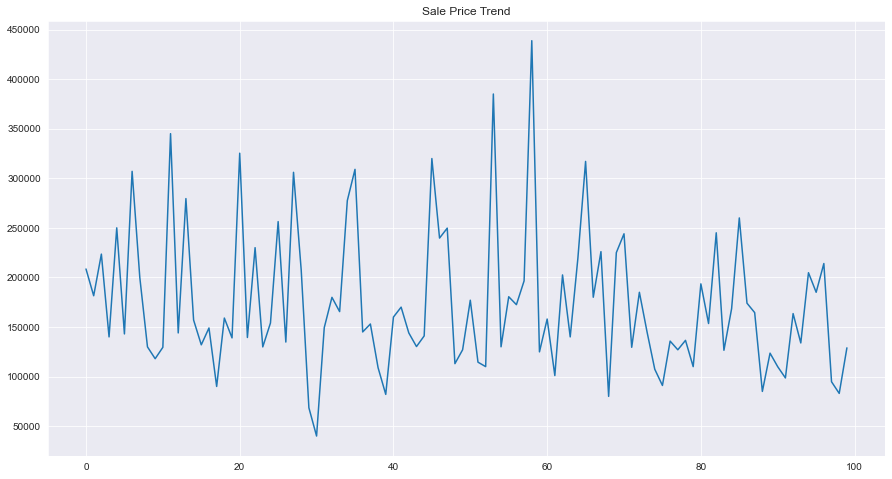
sns.lineplot(data=df[:100]['SalePrice'])

png

Violin Plot

[Back to top]

plt.figure(figsize=(12,6))
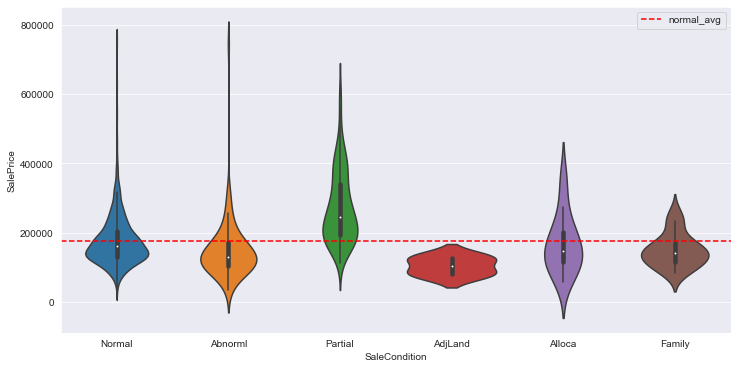
sns.violinplot(x = df['SaleCondition'], y = df['SalePrice'])
plt.axhline(df[df['SaleCondition'] == 'Normal']['SalePrice'].mean(),\
            color='r',linestyle='dashed',label='normal_avg')
plt.legend()

png

Box Plot

[Back to top]

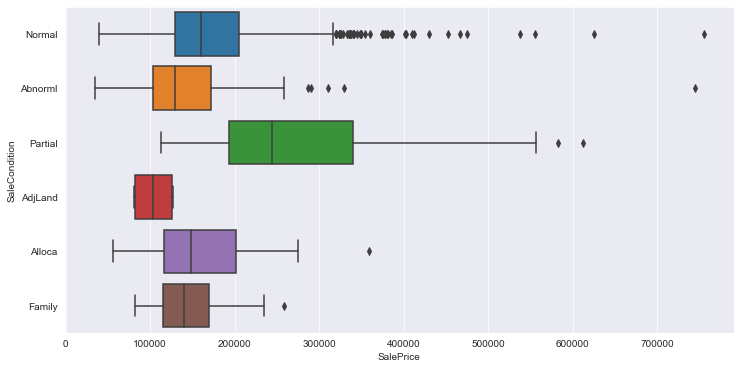
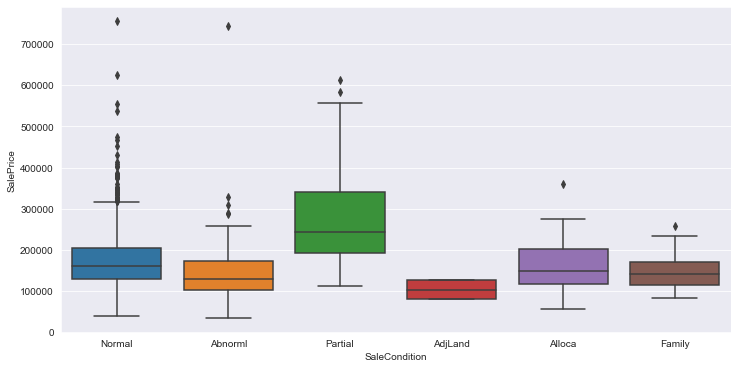
These plots are useful for outlier detection.

  • Horizontal
plt.figure(figsize=(12,6))
sns.boxplot(data=df, y='SaleCondition', x='SalePrice', orient='h')

png

  • Vertical
plt.figure(figsize=(12,6))
sns.boxplot(data=df, x='SaleCondition', y='SalePrice', orient='v')

png

Ridge Line Plot

[Back to top]

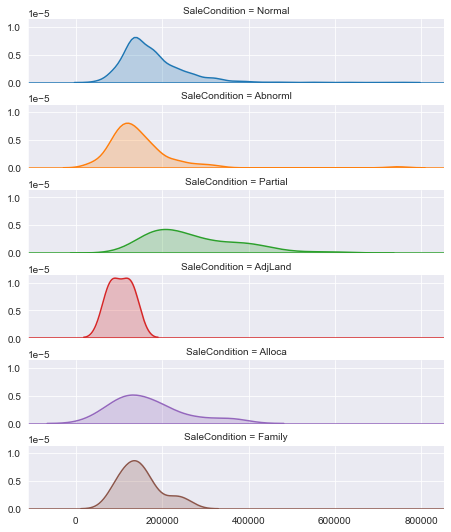
ridge_plot = sns.FacetGrid(df, row="SaleCondition", hue="SaleCondition", aspect=5, height=1.25)  
ridge_plot.map(sns.kdeplot, 'SalePrice', shade=True)
ridge_plot.map(plt.axhline)
ridge_plot.fig.subplots_adjust(hspace=0.35)

png

QQ Plots

[Back to top]

Source: https://seaborn-qqplot.readthedocs.io/en/latest/

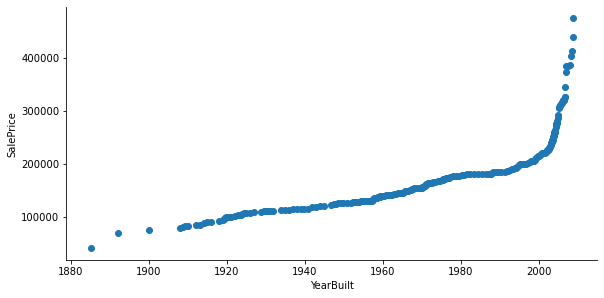
from seaborn_qqplot import pplot
pplot(df.iloc[:250,:], x='YearBuilt', y='SalePrice', kind='qq', height=4, aspect=2)

png

Aug 3, 2021 - Categorical Variables - Barcharts

Categorical Variables - Barcharts

sns.set_style('darkgrid')

Faceted Bar Chart

seaborn
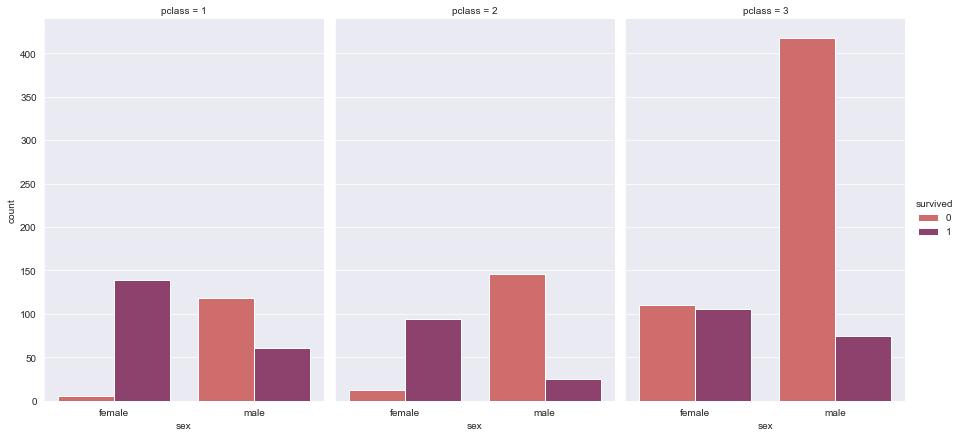
g = sns.catplot(x="sex", y="count",
                hue="survived", col="pclass",
                data=df, kind="bar",
                height=6, aspect=.7, palette="flare");

png

Basic Bar Chart

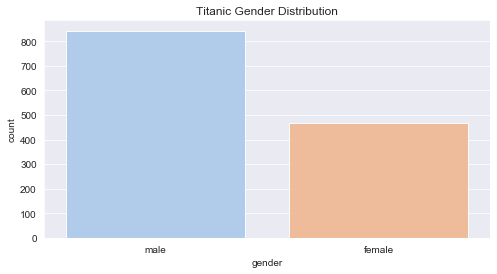
df_copy2  = df['sex'].value_counts().reset_index()
df_copy2.columns = ['gender', 'count']
df = df_copy2
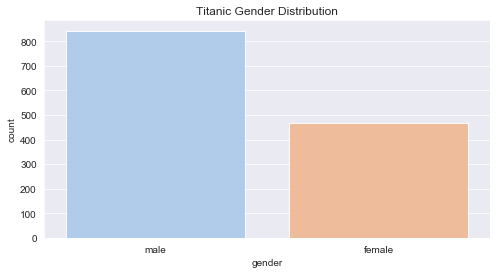
seaborn
plt.figure(figsize=(8,4))
plt.title('Titanic Gender Distribution')

sns.barplot(x='gender', y='count', data=df, palette='pastel', alpha=0.9)

png

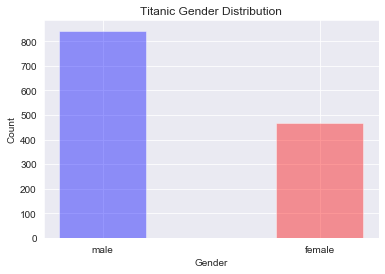
matplotlib
plt.title('Titanic Gender Distribution')
plt.bar(x=df['gender'], height=df['count'], color=['blue', 'red'], alpha=0.4, width=0.4)
plt.xlabel('Gender')
plt.ylabel('Count')

png

Horizontal Bar charts

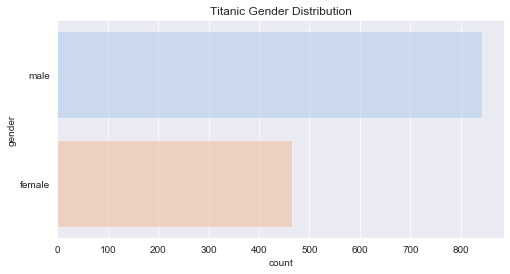
seaborn
# Flip the x and y variables
plt.figure(figsize=(8,4))
plt.title('Titanic Gender Distribution')
sns.barplot(x='count', y='gender', data=df, palette='pastel', alpha=0.5)

png

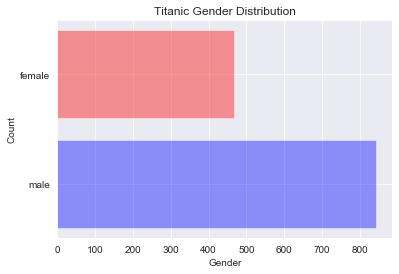
matplotlib
# y and width are the passed params
plt.title('Titanic Gender Distribution')
plt.barh(y=df['gender'], width=df['count'], color=['blue', 'red'], alpha=0.4)
plt.xlabel('Gender')
plt.ylabel('Count')

png

Reordering the bars

seaborn
# notice the order parameter
plt.figure(figsize=(8,4))
plt.title('Titanic Gender Distribution')

sns.barplot(x='gender', y='count', data=df, palette='pastel', alpha=0.9, order=['male', 'female'])

png

matplotlib

Done by ordering the dataframe and then plotting

Jul 2, 2021 - Categorical Variables - Cleveland Dot Plots

Cleveland Dot Plots

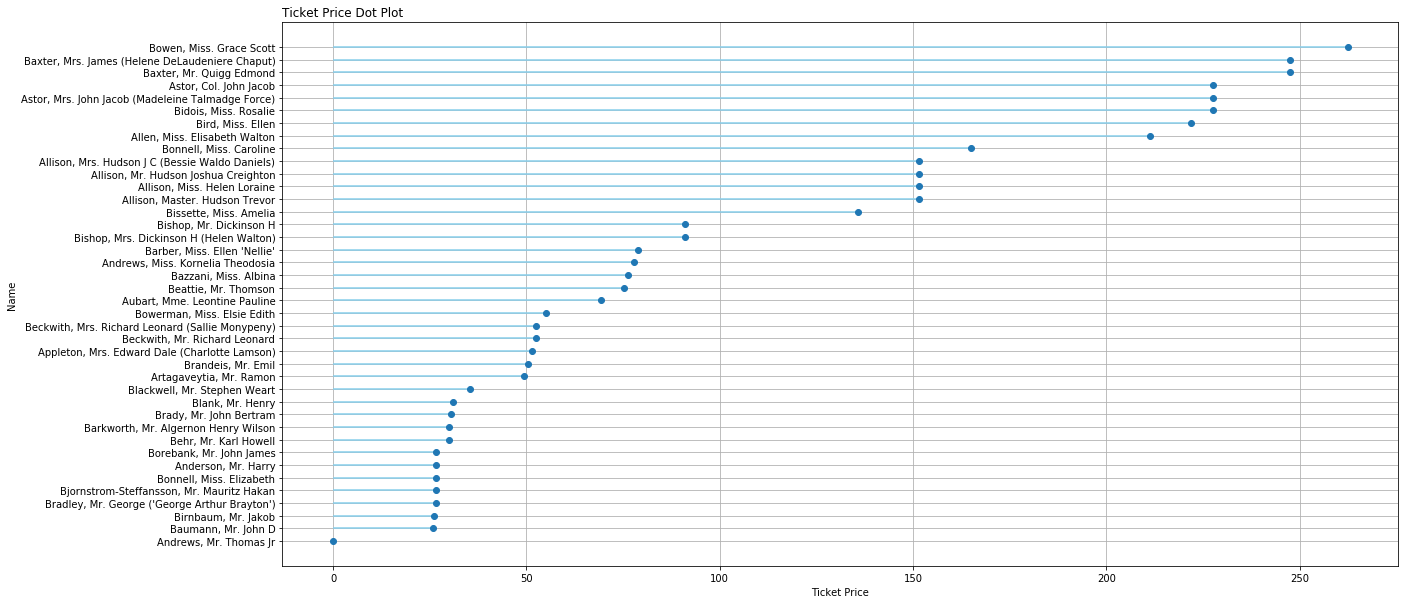
Cleveland Dot Plot

matplotlib
plt.figure(figsize=(20,10))
plt.hlines(y=my_range, xmin=0, xmax=df['fare'], color='skyblue')
plt.grid(True)
plt.plot(df['fare'], my_range, "o")
plt.yticks(my_range, df['name'])
plt.title("Ticket Price Dot Plot", loc='left')
plt.xlabel('Ticket Price')
plt.ylabel('Name')

png

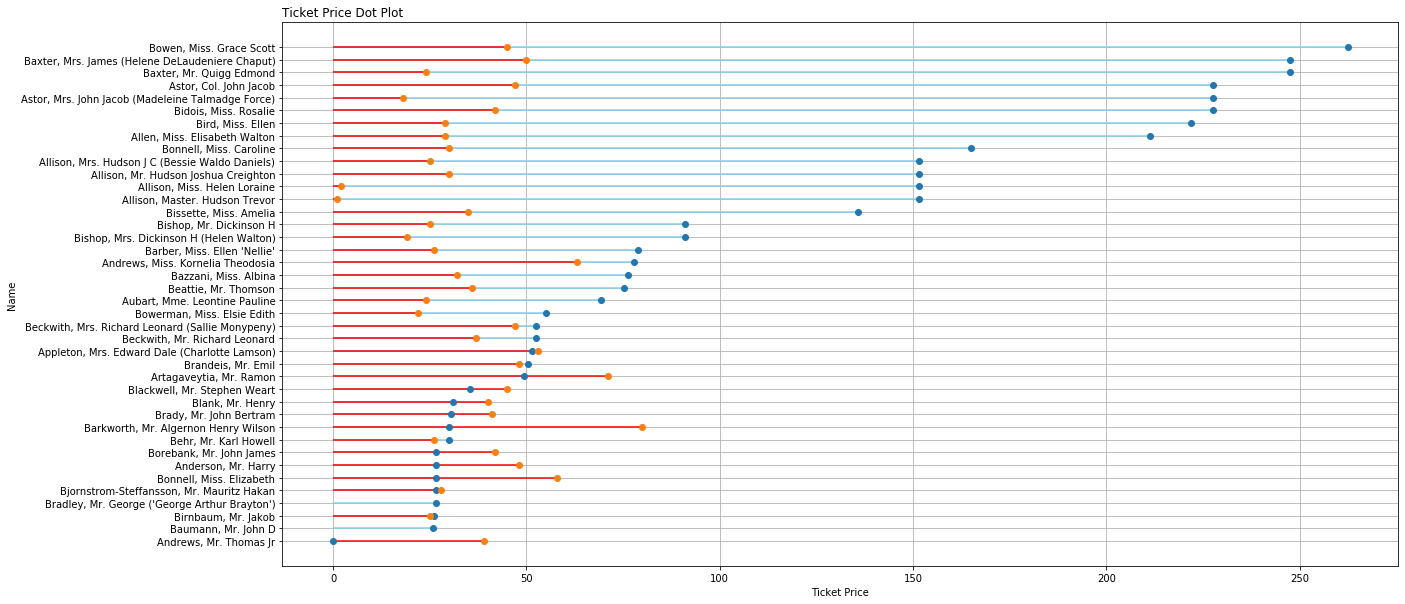
Multiple Dots

matplotlib

Sorting has to be done through dataframe only.

plt.figure(figsize=(20,10))
plt.hlines(y=my_range, xmin=0, xmax=df['fare'], color='skyblue')
plt.hlines(y=my_range, xmin=0, xmax=df['age'], color='red')

plt.grid(True)
plt.plot(df['fare'], my_range, "o")
plt.plot(df['age'], my_range, "o")

plt.yticks(my_range, ordered_df['name'])
plt.title("Ticket Price Dot Plot", loc='left')
plt.xlabel('Ticket Price')
plt.ylabel('Name')

png

Jun 1, 2021 - Multivariate Continuous

Content

About the dataset

Context

This dataset is originally from the National Institute of Diabetes and Digestive and Kidney Diseases. The objective of the dataset is to diagnostically predict whether or not a patient has diabetes, based on certain diagnostic measurements included in the dataset. Several constraints were placed on the selection of these instances from a larger database. In particular, all patients here are females at least 21 years old of Pima Indian heritage.

Content

The datasets consists of several medical predictor variables and one target variable, Outcome. Predictor variables includes the number of pregnancies the patient has had, their BMI, insulin level, age, and so on.

Acknowledgements

Smith, J.W., Everhart, J.E., Dickson, W.C., Knowler, W.C., & Johannes, R.S. (1988). Using the ADAP learning algorithm to forecast the onset of diabetes mellitus. In Proceedings of the Symposium on Computer Applications and Medical Care (pp. 261–265). IEEE Computer Society Press.

Inspiration

Can you build a machine learning model to accurately predict whether or not the patients in the dataset have diabetes or not?

What is “Multivariate”

Multivariate data analysis is a set of statistical models that examine patterns in multidimensional data by considering, at once, several data variables. It is an expansion of bivariate data analysis, which considers only two variables in its models. As multivariate models consider more variables, they can examine more complex phenomena and find data patterns that more accurately represent the real world.


Scatter Plot

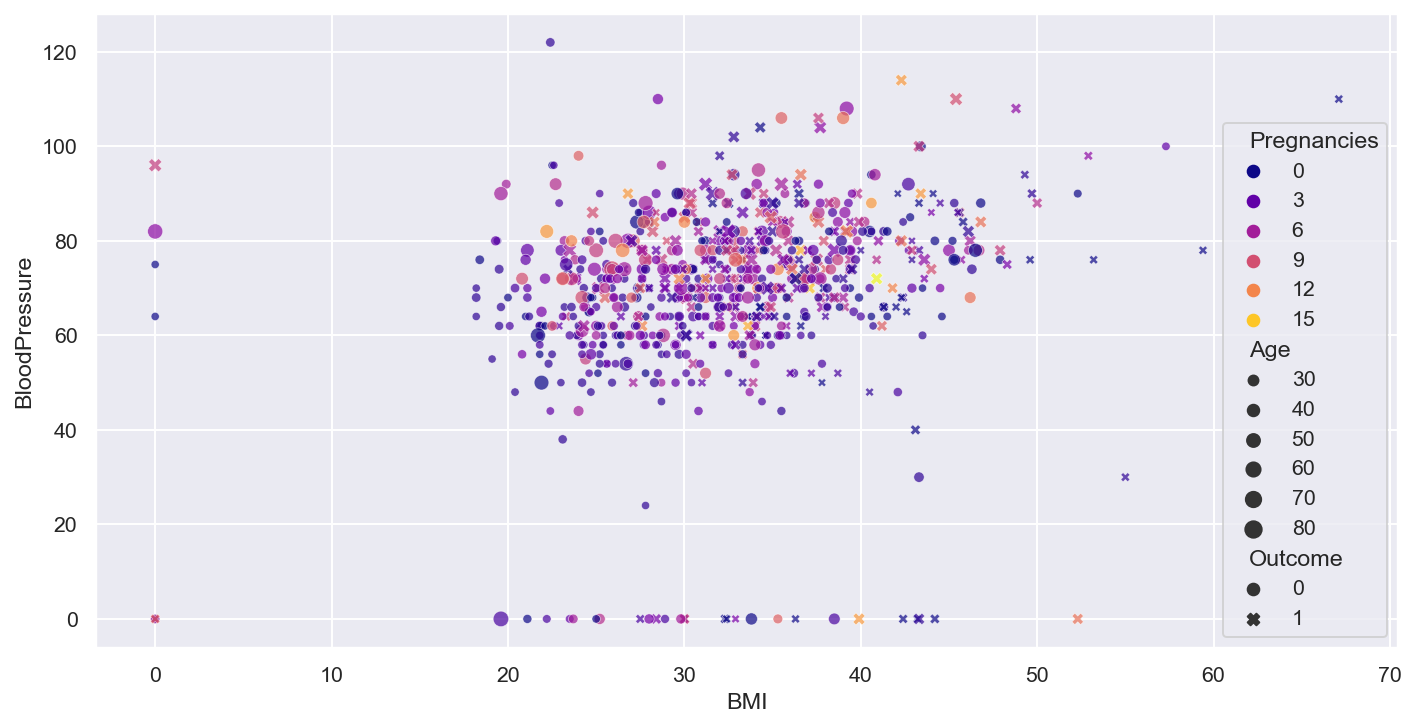
Basic ScatterPlot

  • Rough idea about the relation between variables through the scatter plot, need correlation matrix for better understanding
plt.figure(figsize=(12,6), dpi=140)
num_col1 = 'BMI'
num_col2 = 'BloodPressure'
target= 'Outcome'
cat_num_col1='Pregnancies'
cat_num_col2 ='Age'

sns.scatterplot(x=num_col1, y=num_col2, data=df,
                style=target, hue=cat_num_col1, 
                size=cat_num_col2, alpha=0.7, palette = 'plasma',
)#,sizes=(20,100), hue_norm=(0,15))
png

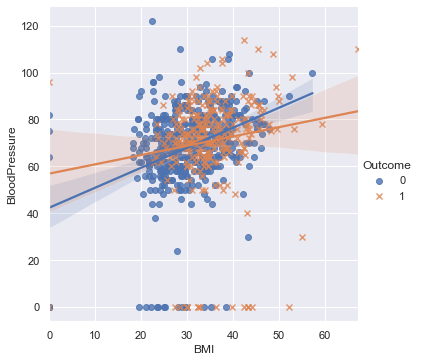
With regression Line

  • Rough idea about the relation between variables through the scatter plot, need correlation matrix for better understanding
plt.figure(figsize=(12,6), dpi=140)
num_col1 = 'BMI'
num_col2 = 'BloodPressure'
target= 'Outcome'
cat_num_col1='Pregnancies'
cat_num_col2 ='Age'

sns.lmplot(x=num_col1, y=num_col2, markers=['o','x'], hue=target, data=df, fit_reg=True)
png

Faceted groups

num_col1 = 'BMI'
num_col2 = 'BloodPressure'
target= 'Outcome'
cat_num_col1='Pregnancies'
cat_num_col2 ='Age'

sns.relplot(
    data=df, x=num_col1, y=num_col2,
    col=target, hue=cat_num_col1, size=cat_num_col2, style = target,palette = 'plasma',
    kind="scatter"#,aspect=0.5, height=12
)
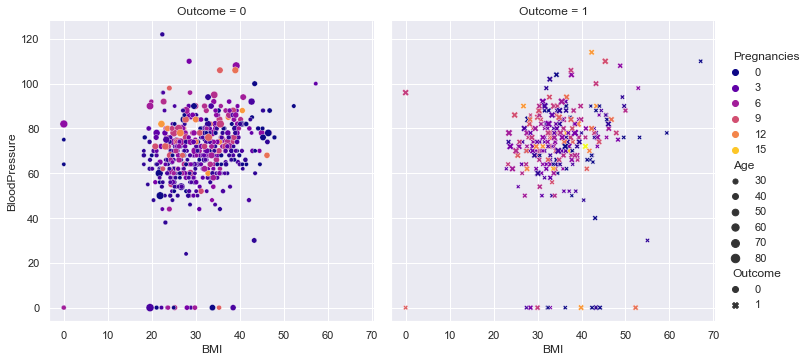
png

Basic Pair Plot

  • Observe the distribution for skewness and outliers in the diagonal of the pair plot.
  • Rough idea about the relation between variables through the scatter plot, need correlation matrix for better understanding
plt.figure(dpi=140)
sns.pairplot(df)
plt.show()
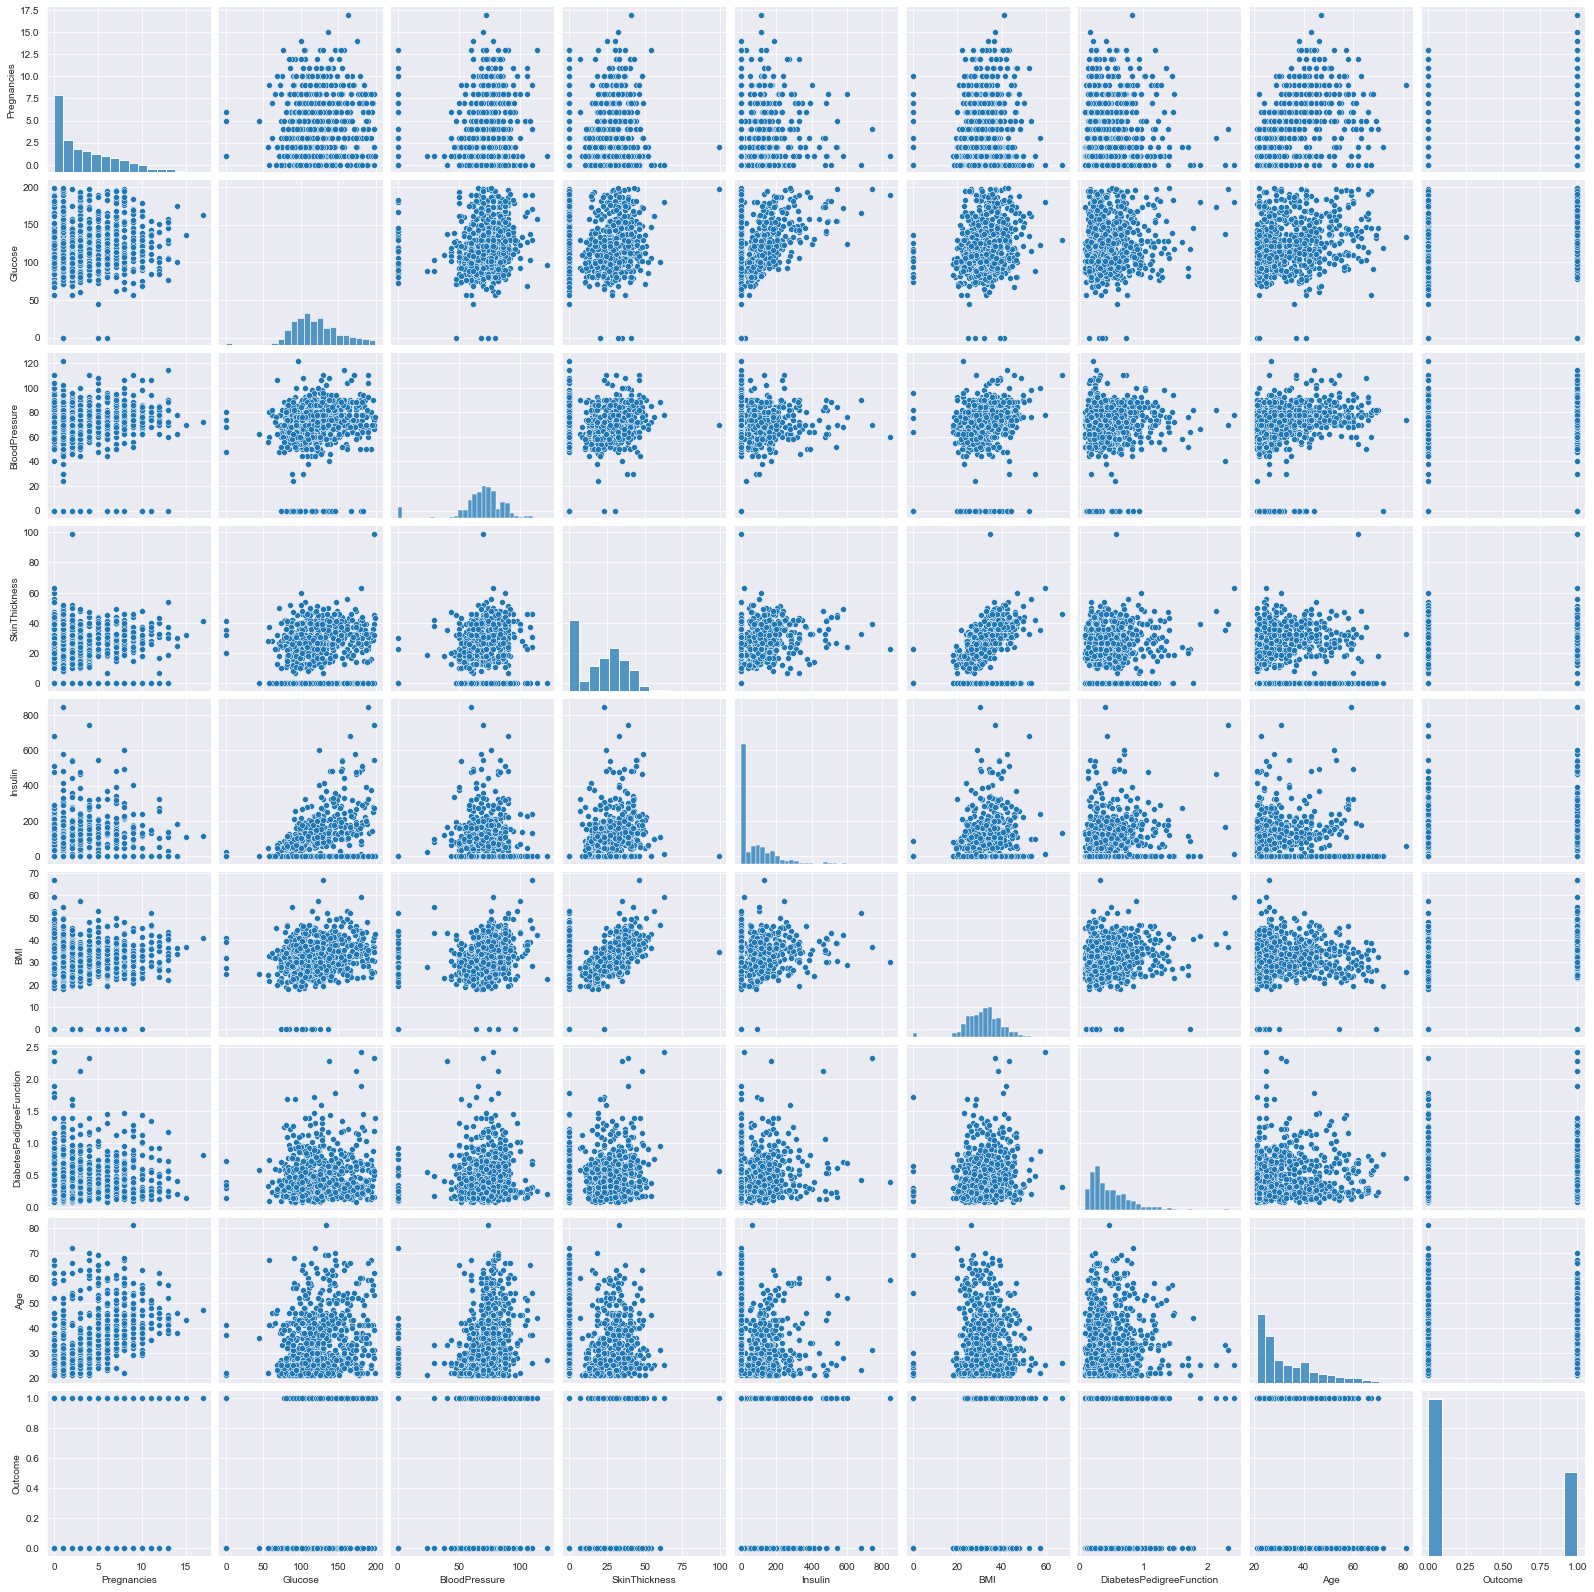
png

Category Wise Pair Plot

  • Observe the various scatter plots for linear seperability to hypothesize linear/non-linear model
  • the density curve on the diagonal point normality of the variables, in this example skewness exist, can be due to outliers, (can try to remove them and re-plot)
plt.figure(dpi = 140)
sns.pairplot(df,hue = 'Outcome',palette = 'plasma')
plt.legend(['Non Diabetic','Diabetic'])
plt.show()
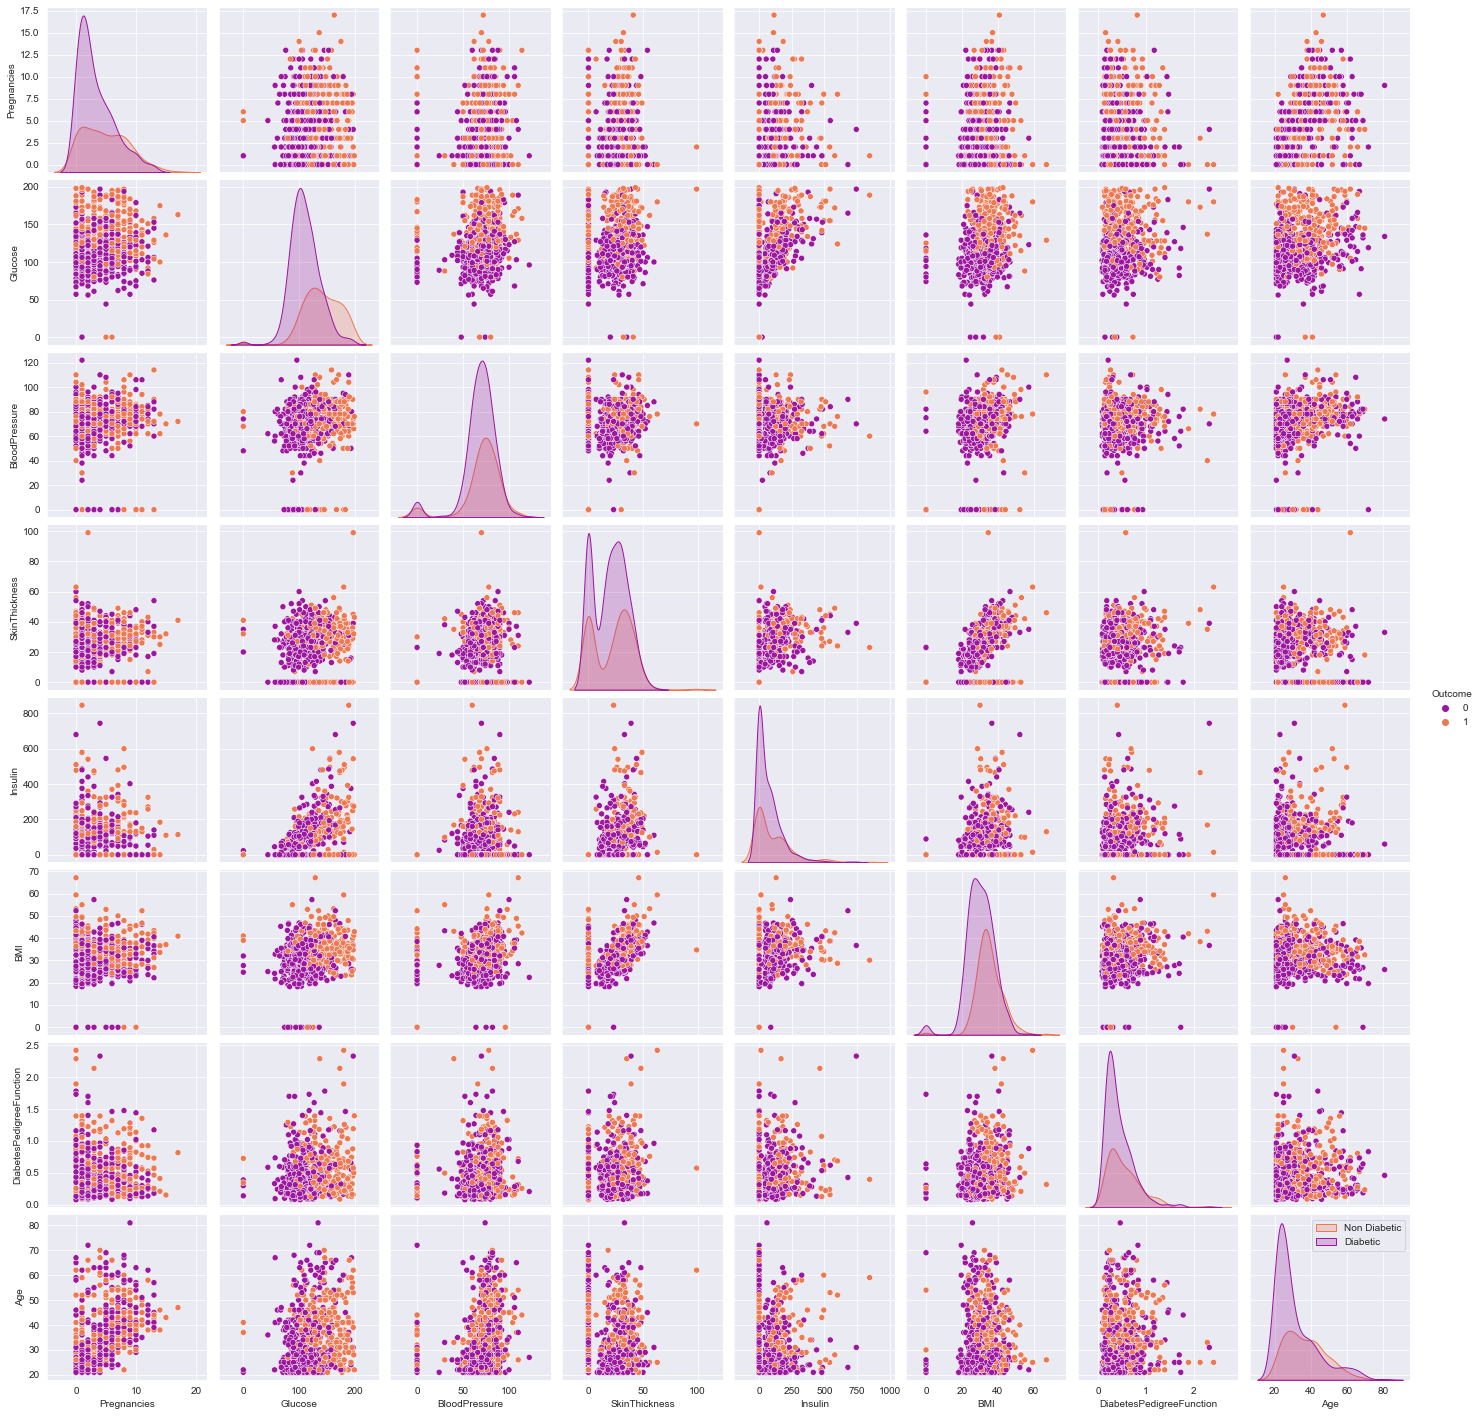
png

Contour lines Plot

sns.kdeplot(data=df, x=num_col1, y=num_col2, hue=target,fill=True,alpha=0.5,palette = 'plasma')
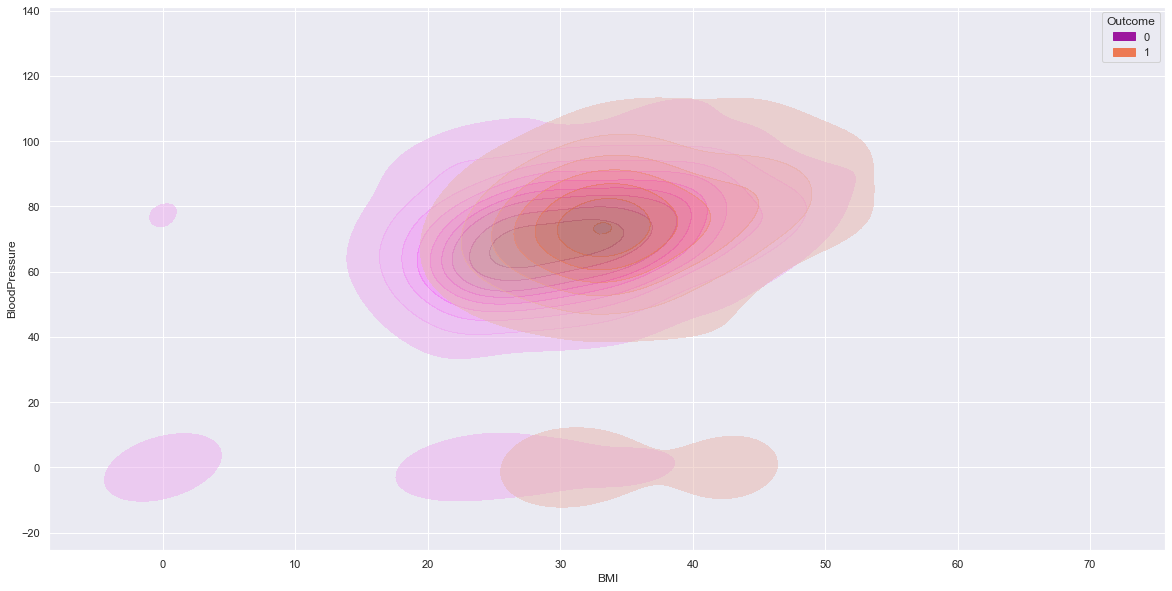
png

Correlations

  • All correlations less than or around 0.5. Therefore, Not very strong linear correlations.

Diverging Palette Red

plt.figure(figsize= (14,8))
# cmap=sns.diverging_palette(5, 250, as_cmap=True)
cmap = sns.diverging_palette(250, 10, as_cmap=True)
ax = sns.heatmap(df.corr(),center = 0,annot= True,linewidth=0.5,cmap= cmap)
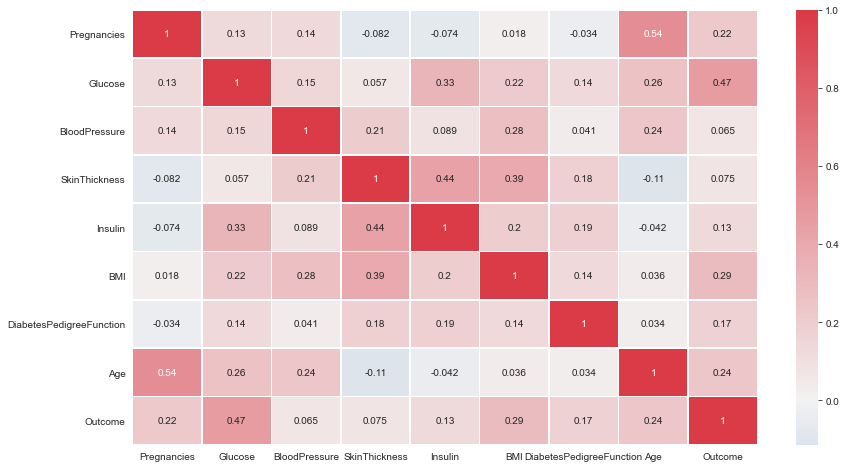
png

Diverging Palette Blue with upper triangle Mask

corr = df.corr()
plt.figure(figsize=(14,8))
cmap=sns.diverging_palette(5, 250, as_cmap=True)
mask = np.zeros_like(corr)
mask[np.triu_indices_from(mask)] = True
with sns.axes_style("white"):
    ax = sns.heatmap(corr, mask=mask, vmax=.3, square=True,cmap=cmap,center = 0,annot=True)
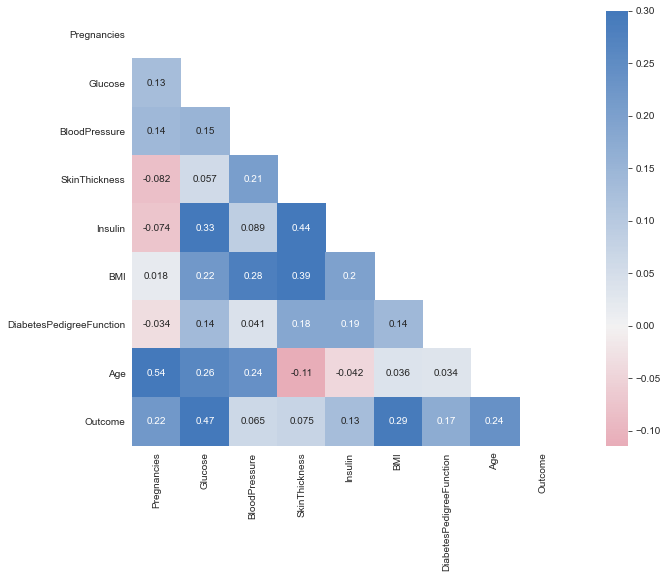
png

Plasma Palette with upper triangle mask

plt.figure(dpi = 80,figsize= (14,8))
mask = np.triu(np.ones_like(df.corr(),dtype = bool))
sns.heatmap(df.corr(),mask = mask, fmt = ".2f",annot=True,lw=1,cmap = 'plasma')
plt.yticks(rotation = 0)
plt.xticks(rotation = 90)
plt.title('Correlation Heatmap')
plt.show()
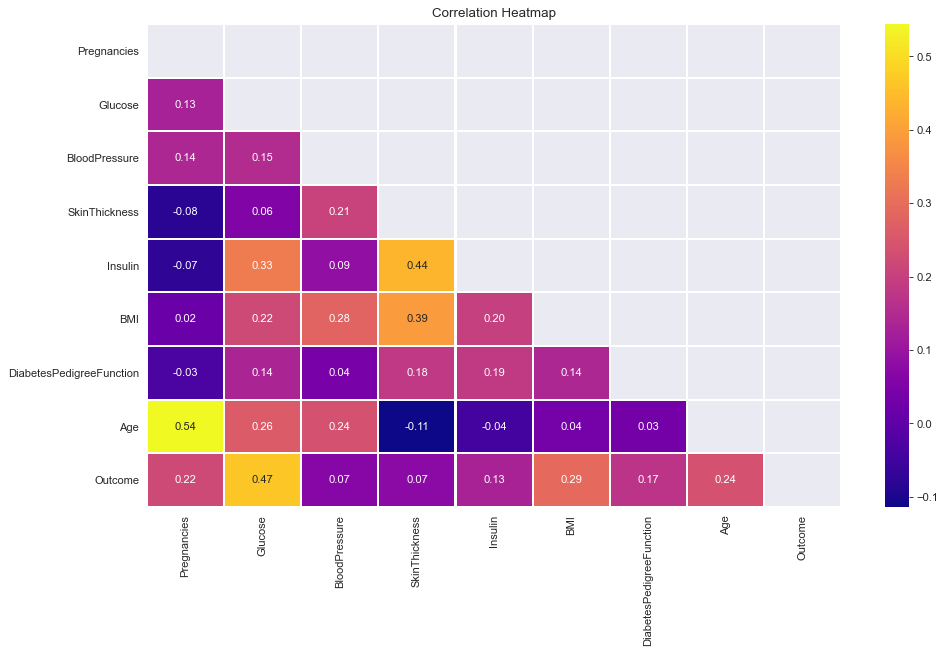
png

Joint Plots

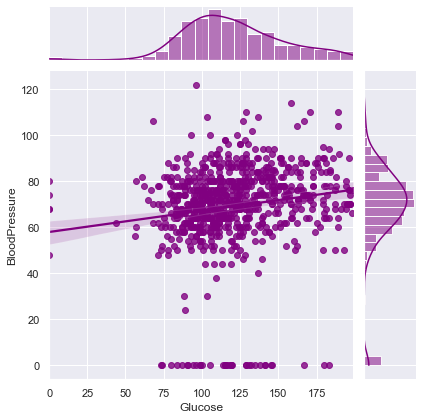
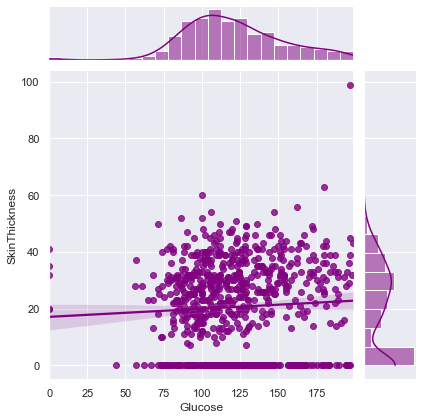
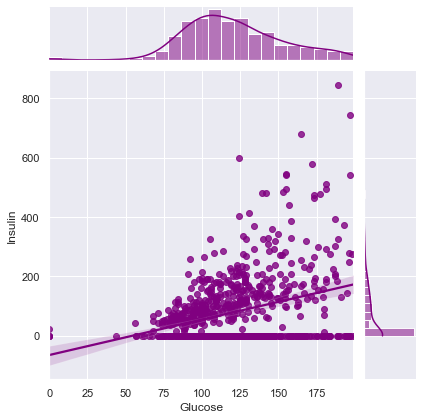
  • Dig deeper for each variable and its association with other variables.
  • in this example,
    • Glucose shows positive weak linear association with other variable in given dataset.

      That means On increasing Glucose level in patients, Other variables will also increase. Weak linear association is good because we can escape out from Multicollinearity effect in Predective Modelling.

plt.figure(dpi = 100, figsize = (5,4))
comparsion_variable = 'Glucose'
target = 'Outcome'

print("Joint plot of {} with Other Variables ==> \n".format(comparsion_variable))
for i in  df.columns:
    if i != comparsion_variable and i != target:
        print(f"Correlation between {comparsion_variable} and {i} ==> ",df.corr().loc[comparsion_variable][i])
        sns.jointplot(x=comparsion_variable,y=i,data=df,kind = 'reg',color = 'purple')
        plt.show()
Joint plot of Glucose with Other Variables ==> 

Correlation between Glucose and Pregnancies ==>  0.129458671499273
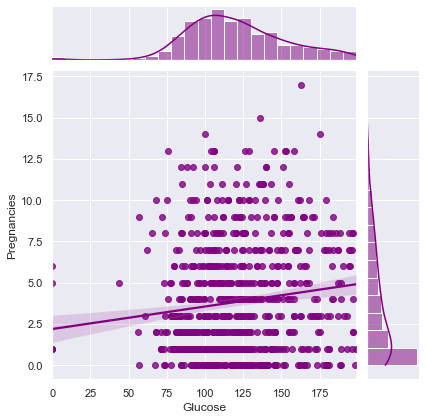
png

Correlation between Glucose and BloodPressure ==>  0.15258958656866448
png

Correlation between Glucose and SkinThickness ==>  0.057327890738176825
png

Correlation between Glucose and Insulin ==>  0.3313571099202081
png

Correlation between Glucose and BMI ==>  0.22107106945898305
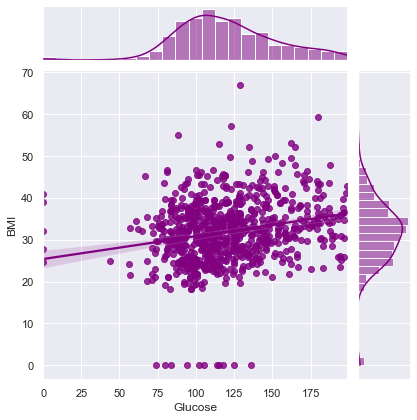
png

Correlation between Glucose and DiabetesPedigreeFunction ==>  0.1373372998283708
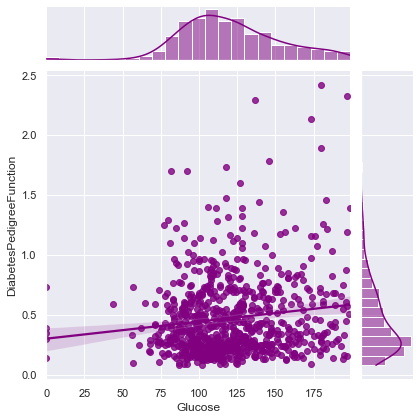
png

Correlation between Glucose and Age ==>  0.26351431982433376
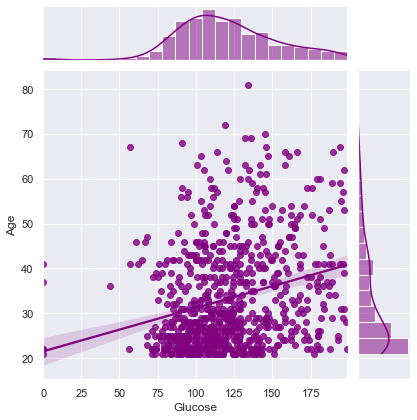
png

Parallel Plots

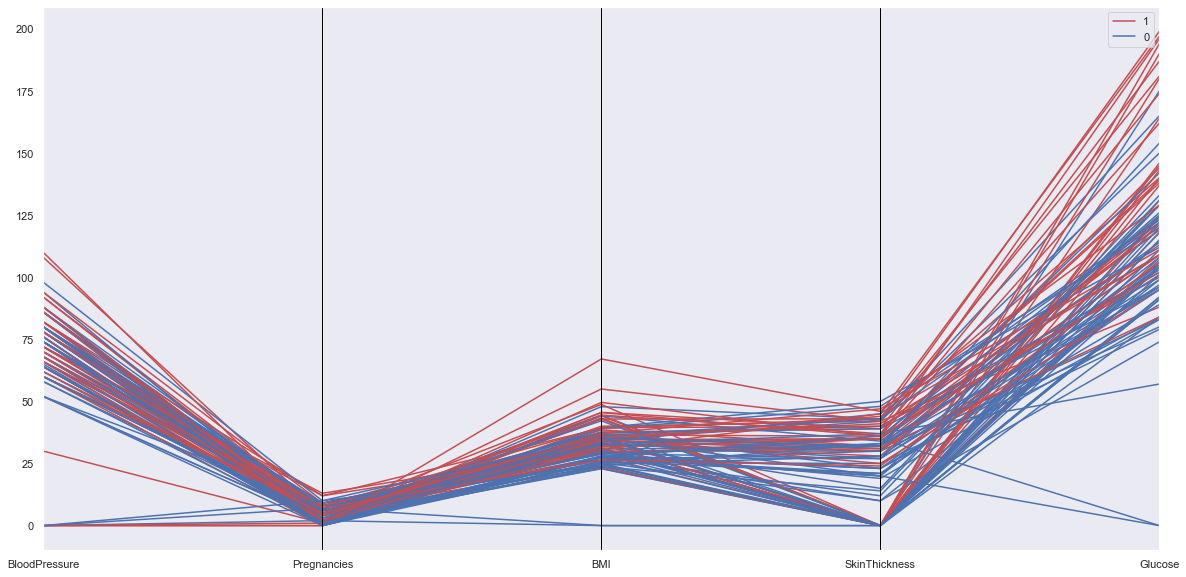
from pandas.plotting import parallel_coordinates

numeric_cols = ['BloodPressure','Pregnancies','BMI','SkinThickness','Glucose',target]

tdf = df.sample(100)

parallel_coordinates(tdf[numeric_cols], target, color = ['r','b'])
png

Refrences

  • https://www.kaggle.com/ravichaubey1506/multivariate-statistical-analysis-on-diabetes/notebook
  • https://seaborn.pydata.org/generated/seaborn.scatterplot.html
  • https://www.kaggle.com/princeashburton/multivariate-plotting
May 2, 2021 - Categorical Variables - Heatmaps

Binplots

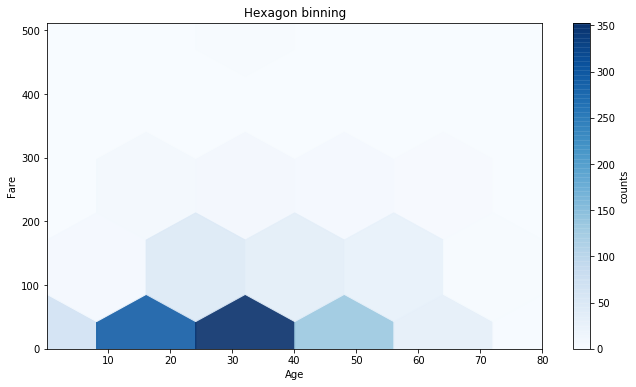
Hexagonal Binplots

matplotlib

fig, axs = plt.subplots(ncols=1, sharey=True, figsize=(10, 6))
fig.subplots_adjust(hspace=0.5, left=0.07, right=0.93)
ax = axs
hb = ax.hexbin(df["age"], df["fare"], gridsize=5, cmap='Blues', alpha = 0.9)
ax.axis([min(df['age']), max(df['age']), min(df['fare']), max(df['fare'])])
ax.set_title("Hexagon binning")
cb = fig.colorbar(hb, ax=ax)
cb.set_label('counts')
ax.set_xlabel('Age')
ax.set_ylabel('Fare')

png

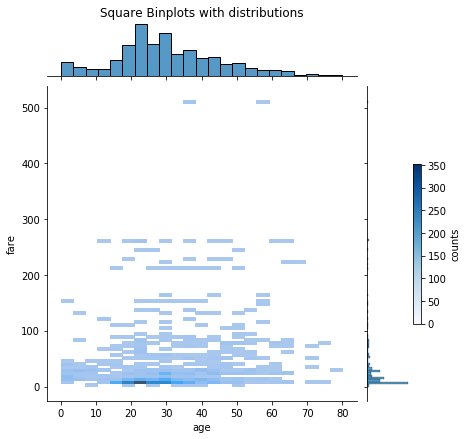
seaborn

x = sns.jointplot(data=df, x="age", y="fare", kind="hist")
x.ax_joint.set_title("Square Binplots with distributions", pad=70.0)
cb = fig.colorbar(hb, ax=x.ax_marg_y)
cb.set_label('counts')
print(ax)
plt.show()

png

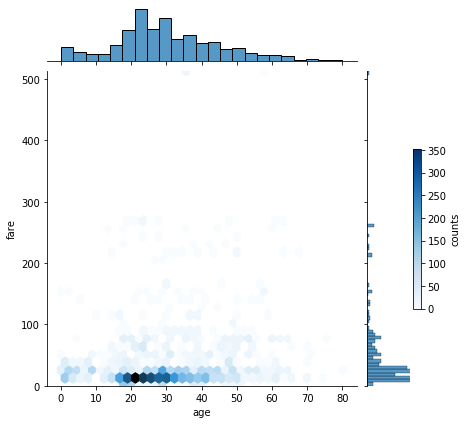
x = sns.jointplot(data=df, x="age", y="fare", kind="hex")
x.ax_marg_y.axis([min(df['age']), max(df['age']), min(df['fare']), max(df['fare'])])
cb = fig.colorbar(hb, ax=x.ax_marg_y)
cb.set_label('counts')

png

Apr 2, 2021 - Categorical Variables - Mosaic Plots

Mosaic Plots

from statsmodels.graphics.mosaicplot import mosaic
#df = pd.DataFrame({'size' : ['small', 'large', 'large', 'small', 'large', 'small', 'large', 'large'], 'length' : ['long', 'short', 'medium', 'medium', 'medium', 'short', 'long', 'medium'], 'temp' : ['cold', 'hot', 'cold', 'warm', 'warm', 'cold', 'hot', 'warm']})

props = {}
single_low = 28
max_start = 255
max_start_oth = 229
diff = 25
r,g,b=max_start,max_start_oth,max_start_oth
for x in df['sex'].unique(): #unique colums in each
    for y in df['pclass'].unique():
        col = '#{}{}{}'.format(format(int(r),'02x'),format(int(g),'02x'),format(int(b),'02x'))
        for z in df['survived'].unique():
            props[(str(z), str(y), str(x))] ={'color': col}
            if r==max_start:
                g-=diff
                b-=diff
            elif b==max_start:
                r-=diff
                g-=diff
            elif g==max_start:
                r-=diff
                b-=diff
            if (g<single_low and b<single_low):
                b,r,g=max_start,max_start_oth,max_start_oth
            elif (r<single_low and g<single_low):
                g,b,r = max_start,max_start_oth,max_start_oth
            elif (r<single_low and b<single_low):
                print("no more colors")
import matplotlib as mpl
from statsmodels.graphics.mosaicplot import mosaic
mpl.rc("figure", figsize=(14,5))
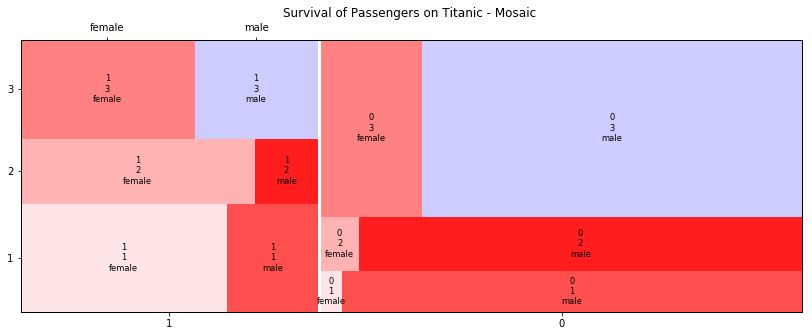
mosaic(df, ['survived', 'pclass', 'sex'], properties=props, title='Survival of Passengers on Titanic - Mosaic ')
plt.show()

png

Mar 2, 2021 - Categorical Variables - Others

Other Categorical Plots

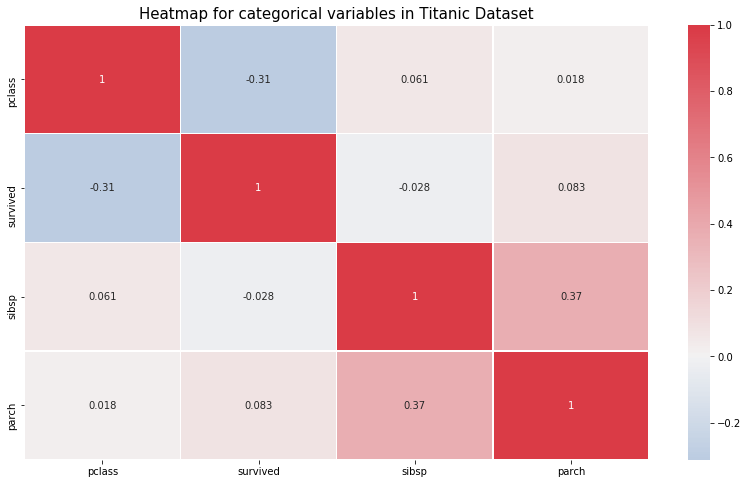
Correlation Plots

plt.figure(figsize= (14,8))
# cmap = cmap=sns.diverging_palette(5, 250, as_cmap=True)
cmap = sns.diverging_palette(250, 10, as_cmap=True)
ax = sns.heatmap(df.corr(),center = 0,annot= True,linewidth=0.5,cmap= cmap)
plt.title('Heatmap for categorical variables in Titanic Dataset', size=15)

png

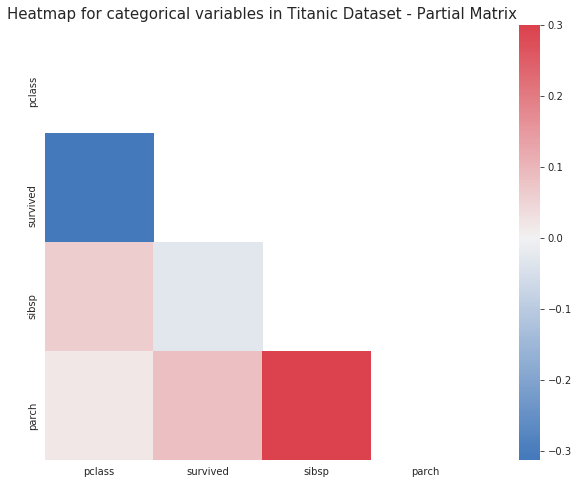
Symmetric Matrix - hence only showing the lower half
corr = df.corr()
plt.figure(figsize=(14,8))
mask = np.zeros_like(corr)
mask[np.triu_indices_from(mask)] = True
with sns.axes_style("white"):
    ax = sns.heatmap(corr, mask=mask, vmax=.3, square=True,cmap=cmap,center = 0)
plt.title('Heatmap for categorical variables in Titanic Dataset - Partial Matrix', size=15)

png
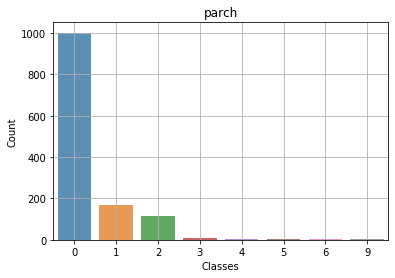
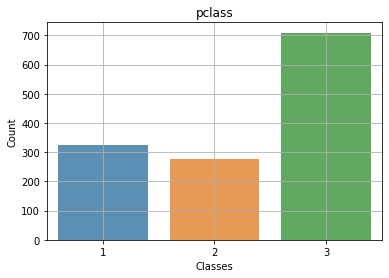
Barplots for each Categorical Column

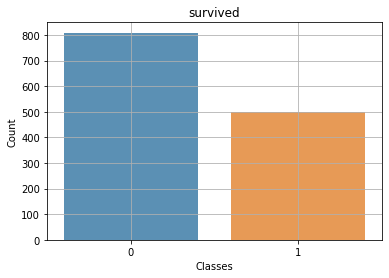
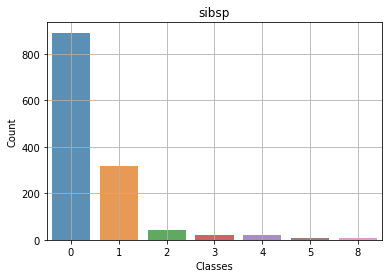
survived_columns = ['pclass', 'survived', 'sibsp', 'parch']
for col in survived_columns:
    val = df[col].value_counts(dropna=False)
    if(len(val.index)>100):
        print("Too many Categories in "+col)
        continue
    sns.barplot(x=val.index,y=val.values,label=True, alpha=0.8)
    plt.title(col)
    plt.ylabel('Count')
    plt.xlabel("Classes")
    plt.grid('True')
    plt.show()

png
png

png

png

Circle Charts - Boolean Columns

import itertools
default = df[df["survived"]==1]
non_default = df[df["survived"]==0]

d_cols =['pclass', 'survived', 'sibsp', 'parch']
d_length = len(d_cols)

fig = plt.figure(figsize=(16,4))
for i,j in itertools.zip_longest(d_cols,range(d_length)):
    plt.subplot(1,4,j+1)
    default[i].value_counts().plot.pie(autopct = "%1.0f%%",colors = sns.color_palette("prism"),startangle = 90,
                                        wedgeprops={"linewidth":1,"edgecolor":"white"},shadow =True)
    circ = plt.Circle((0,0),.7,color="white")
    plt.gca().add_artist(circ)
    plt.ylabel("")
    plt.title(i+"-Survivor")


fig = plt.figure(figsize=(16,4))
for i,j in itertools.zip_longest(d_cols,range(d_length)):
    plt.subplot(1,4,j+1)
    non_default[i].value_counts().plot.pie(autopct = "%1.0f%%",colors = sns.color_palette("prism",3),startangle = 90,
                                           wedgeprops={"linewidth":1,"edgecolor":"white"},shadow =True)
    circ = plt.Circle((0,0),.7,color="white")
    plt.gca().add_artist(circ)
    plt.ylabel("")
    plt.title(i+"-Dead")

png

png

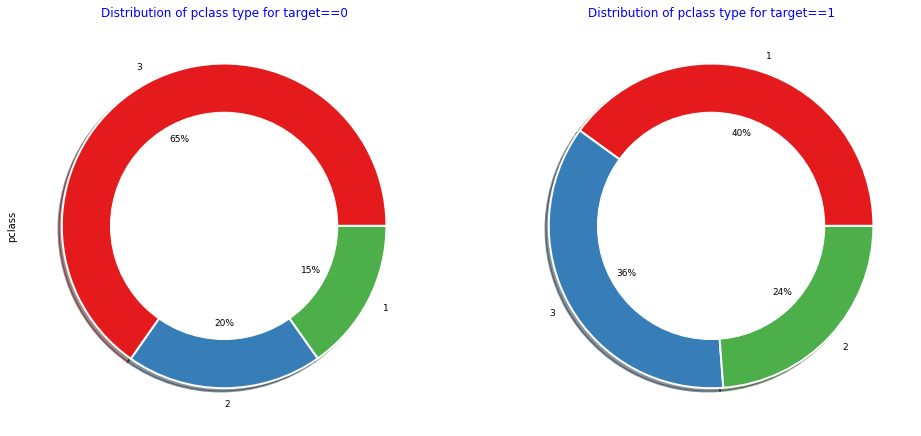
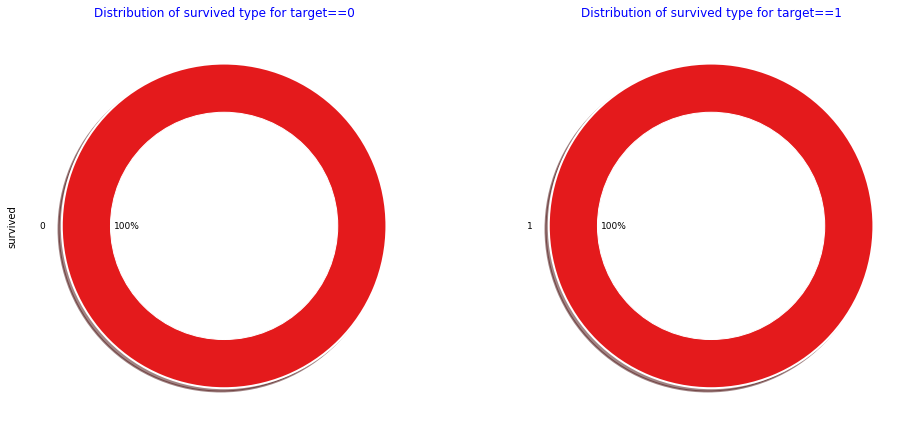
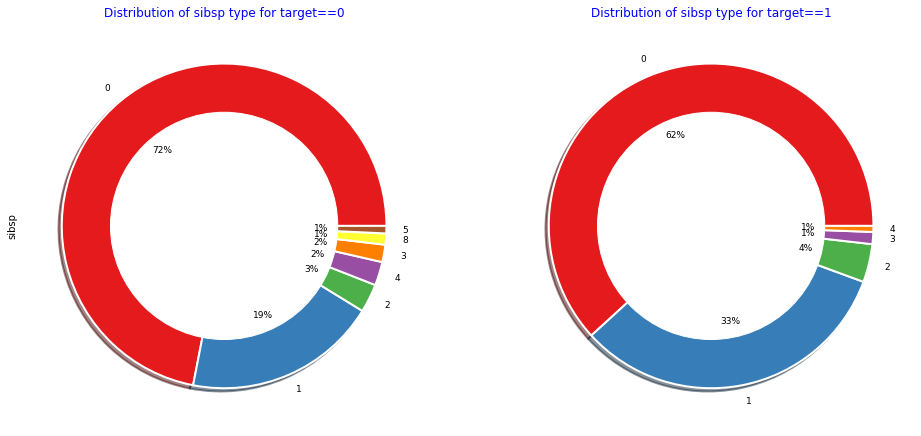
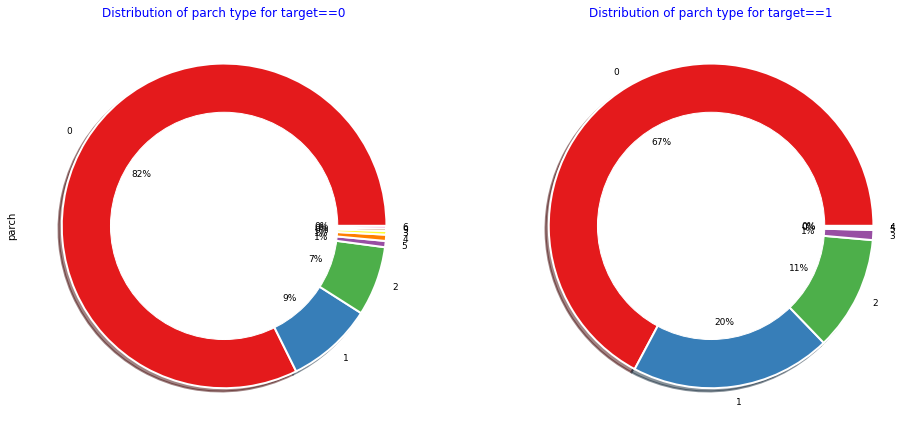
categorical_columns = ['pclass', 'survived', 'sibsp', 'parch']
target = "survived"

for col in categorical_columns:
	plt.figure(figsize=(16,8))
	plt.subplot(121)
	df[df[target]==0][col].value_counts().plot.pie(fontsize=9,autopct = "%1.0f%%",colors = sns.color_palette("Set1"),
	wedgeprops={"linewidth":2,"edgecolor":"white"},shadow =True)
	circ = plt.Circle((0,0),.7,color="white")
	plt.gca().add_artist(circ)
	plt.title("Distribution of "+col+" type for target==0",color="b")

	plt.subplot(122)
	df[df[target]==1][col].value_counts().plot.pie(fontsize=9,autopct = "%1.0f%%", colors = sns.color_palette("Set1"),
	wedgeprops={"linewidth":2,"edgecolor":"white"},shadow =True)
	circ = plt.Circle((0,0),.7,color="white")
	plt.gca().add_artist(circ)
	plt.title("Distribution of "+col+" type for target==1",color="b")
	plt.ylabel("")
	plt.show()

png

png

png

png


Feb 1, 2021 - Spatial Data

Spatial Data

Contents:

Folium Maps

[Back to top]

#!conda install -c conda-forge geopy --yes 
from geopy.geocoders import Nominatim # convert an address into latitude and longitude values
#!conda install -c conda-forge folium=0.5.0 --yes
import folium # map rendering library
address = 'New York, USA'

geolocator = Nominatim(user_agent="nyc_explorer")
location = geolocator.geocode(address)
latitude = location.latitude
longitude = location.longitude
map_nyc = folium.Map(location=[latitude, longitude], zoom_start=12)

map_nyc

png

cu_lat = 40.8075
cu_lng = -73.9626
map_cu = folium.Map(location=[cu_lat, cu_lng], zoom_start=16)

folium.CircleMarker(
    [cu_lat, cu_lng],
    radius=10,
    color='blue',
    fill=True,
    fill_color='#3186cc',
    fill_opacity=0.7,
    parse_html=False).add_to(map_cu)

map_cu

png

Chloropleth Maps

[Back to top]

#!conda install -c plotly plotly
import plotly.express as px
import plotly.offline as py
py.init_notebook_mode(connected=True)
df_px = px.data.election()
geojson = px.data.election_geojson()

fig = px.choropleth(df_px, geojson=geojson, color="Bergeron",
                    locations="district", featureidkey="properties.district",
                    projection="mercator"
                   )
fig.update_geos(fitbounds="locations", visible=False)
fig.update_layout(margin={"r":0,"t":0,"l":0,"b":0})
#fig.show() # Use this to render the plot in your notebook

py.plot({"data": fig}, output_type="div", show_link="False", include_plotlyjs="False", link_text="") # For HTML rendering

Jan 2, 2021 - Interactive Graphs

import numpy as np
import pandas as pd
import matplotlib.pyplot as plt
import seaborn as sns
%matplotlib inline

import plotly.offline as py
import plotly.graph_objects as go
py.init_notebook_mode(connected=True)
df = pd.read_csv("https://raw.githubusercontent.com/plotly/datasets/master/school_earnings.csv")
data = [go.Bar(x=df.School,
            y=df.Gap)]
layout = go.Layout(dict(title = "Male and Female gap in schools",
                  xaxis = dict(title = 'Number of students'),
                  yaxis = dict(title = 'School Name'),
                  ))
py.plot(dict(data=data, layout=layout), include_plotlyjs=False, output_type='div')
# py.iplot(dict(data=data, layout=layout),filename='Basic bar plot')

Mar 10, 2020 - Time Series

%matplotlib inline
sns.set_style('darkgrid')

Content

About the dataset

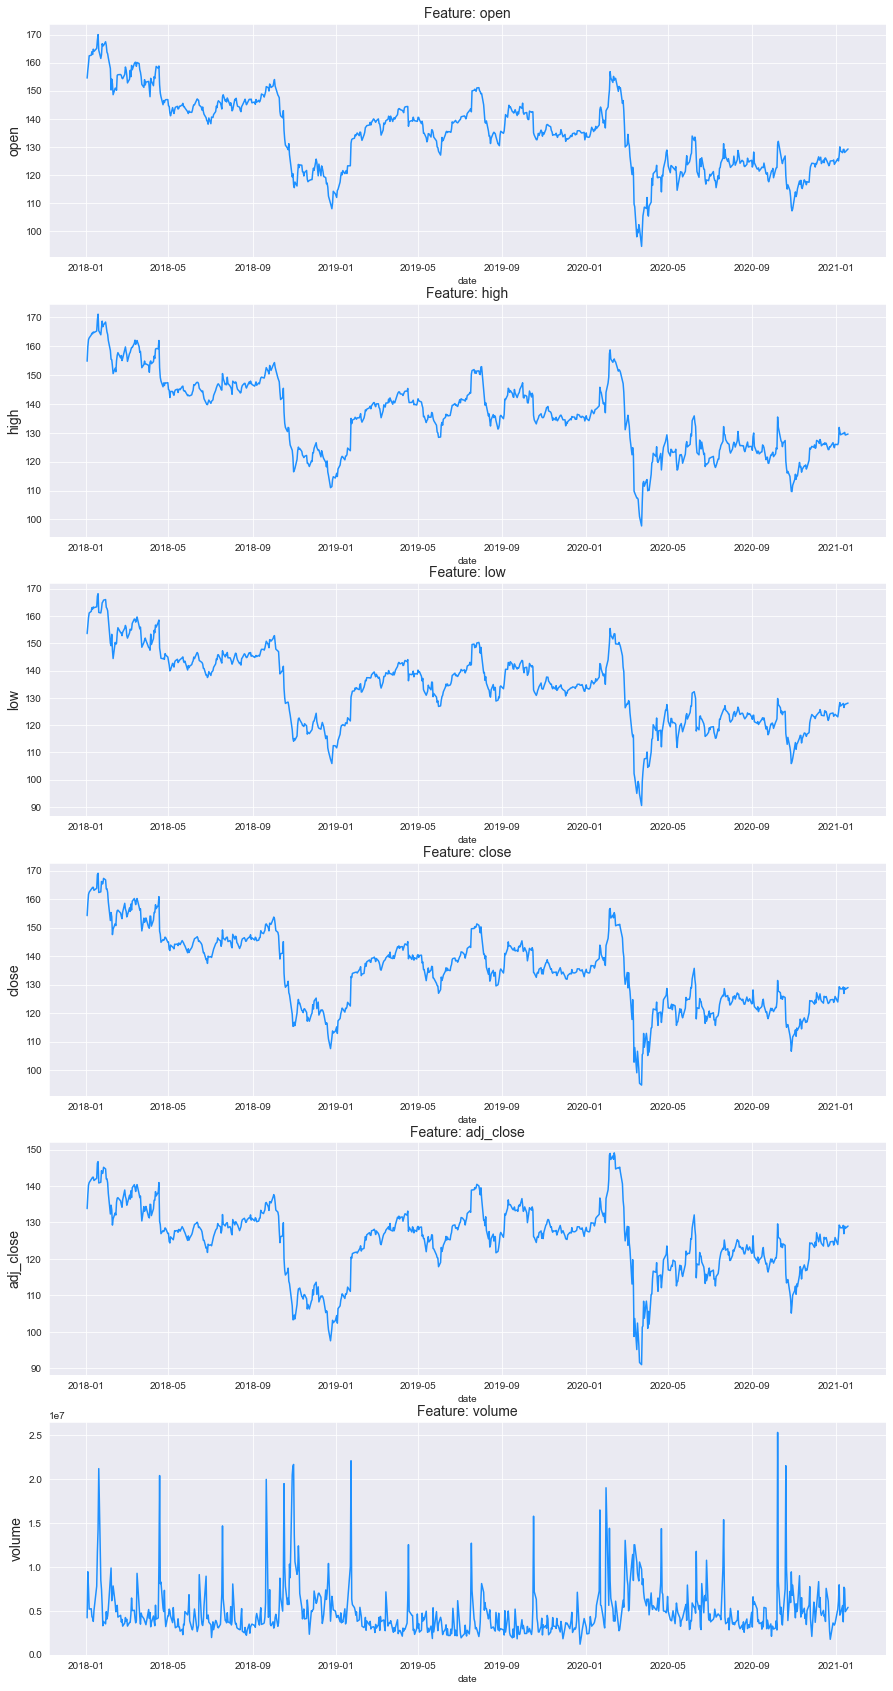
This dataset is originally from the yahoo finance website. For IBM company, ‘open’, ‘high’, ‘low’, ‘close’, ‘adj_close’, ‘volume’ data.

Line Plot

f, ax = plt.subplots(nrows=6, ncols=1, figsize=(15, 30))

for i, col in enumerate(df.drop('date', axis=1).columns):
    sns.lineplot(x='date', y=col,data=df, ax=ax[i], color='dodgerblue')
    ax[i].set_title('Feature: {}'.format(col), fontsize=14)
    ax[i].set_ylabel(ylabel=col, fontsize=14)

png

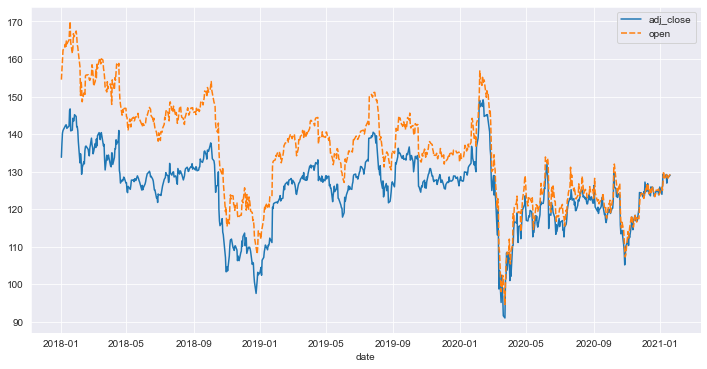
Plot Multiple time series

plt.figure(figsize=(12,6))
sns.lineplot(data=df[['adj_close','open','date']].set_index('date'))

png


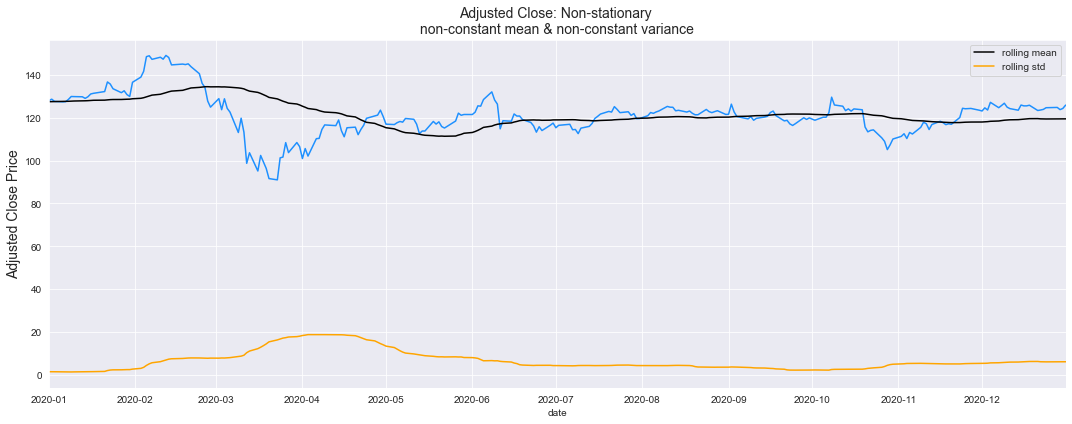
Check stationarity visually using rolling mean

# A year has 52 weeks (52 weeks * 7 days per week) aporx.
rolling_window = 52
f = plt.figure(figsize=(15, 6))
ax = plt.gca()

sns.lineplot(x=df['date'], y=df['adj_close'], color='dodgerblue')
sns.lineplot(x=df['date'], y=df['adj_close'].rolling(rolling_window).mean(),  color='black', label='rolling mean')
sns.lineplot(x=df['date'], y=df['adj_close'].rolling(rolling_window).std(), color='orange', label='rolling std')
ax.set_title('Adjusted Close: Non-stationary \nnon-constant mean & non-constant variance', fontsize=14)
ax.set_ylabel(ylabel='Adjusted Close Price', fontsize=14)
ax.set_xlim([pd.to_datetime('2020-01-01', format='%Y-%m-%d'), pd.to_datetime('2020-12-31', format='%Y-%m-%d')])

plt.tight_layout()
plt.show()

png

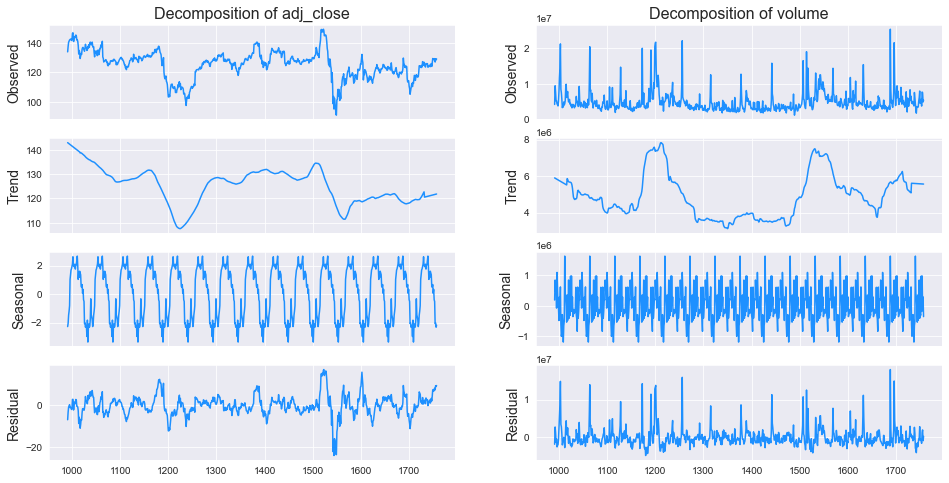
Seasonal and trend Components

from statsmodels.tsa.seasonal import seasonal_decompose

core_columns =  ['adj_close','volume']

for column in core_columns:
    decomp = seasonal_decompose(df[column], period=52, model='additive', extrapolate_trend='freq')
    df[f"{column}_trend"] = decomp.trend
    df[f"{column}_seasonal"] = decomp.seasonal
fig, ax = plt.subplots(ncols=2, nrows=4, sharex=True, figsize=(16,8))

for i, column in enumerate(['adj_close', 'volume']):
    
    res = seasonal_decompose(df[column], freq=52, model='additive', extrapolate_trend='freq')

    ax[0,i].set_title('Decomposition of {}'.format(column), fontsize=16)
    res.observed.plot(ax=ax[0,i], legend=False, color='dodgerblue')
    ax[0,i].set_ylabel('Observed', fontsize=14)

    res.trend.plot(ax=ax[1,i], legend=False, color='dodgerblue')
    ax[1,i].set_ylabel('Trend', fontsize=14)

    res.seasonal.plot(ax=ax[2,i], legend=False, color='dodgerblue')
    ax[2,i].set_ylabel('Seasonal', fontsize=14)
    
    res.resid.plot(ax=ax[3,i], legend=False, color='dodgerblue')
    ax[3,i].set_ylabel('Residual', fontsize=14)

plt.show()

png

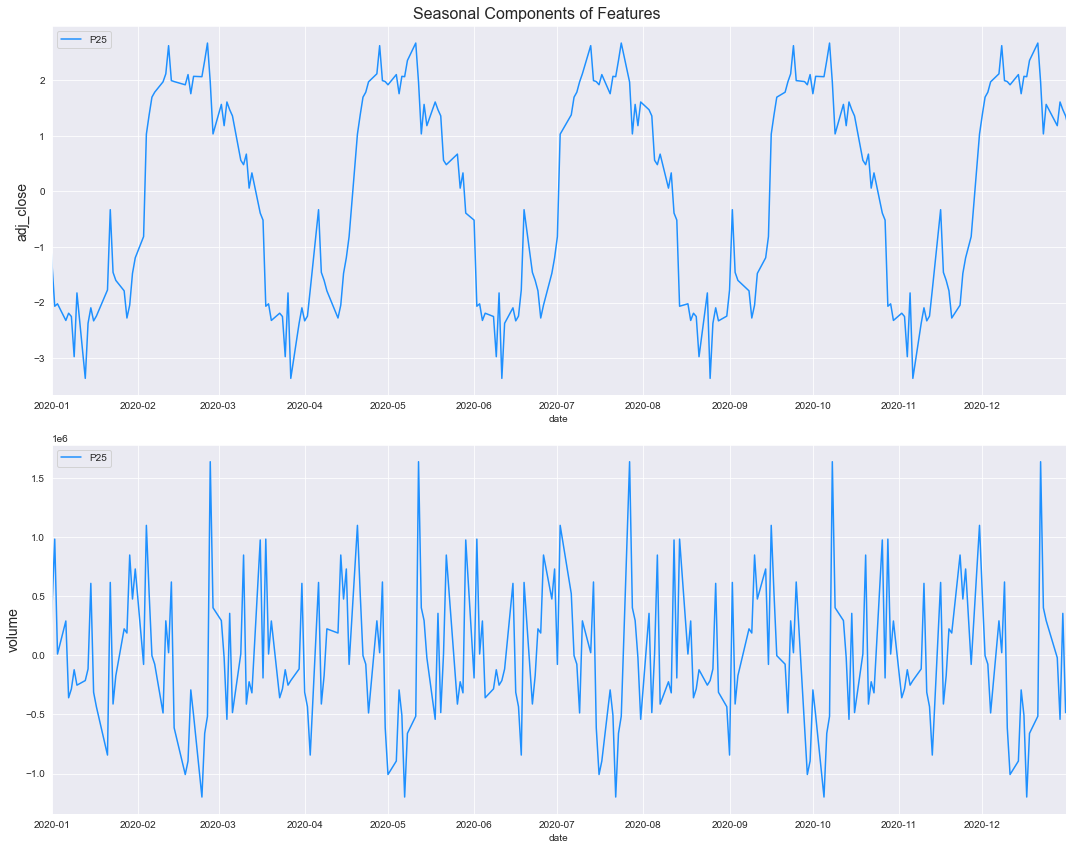
Visual analysis of Seasonality

f, ax = plt.subplots(nrows=2, ncols=1, figsize=(15, 12))
f.suptitle('Seasonal Components of Features', fontsize=16)

for i, column in enumerate(core_columns):
    sns.lineplot(x=df['date'], y=df[column + '_seasonal'], ax=ax[i], color='dodgerblue', label='P25')
    ax[i].set_ylabel(ylabel=column, fontsize=14)
    ax[i].set_xlim([pd.to_datetime('2020-01-01', format='%Y-%m-%d'), pd.to_datetime('2020-12-31', format='%Y-%m-%d')])
    
plt.tight_layout()
plt.show()

png

Refrences

  • https://www.kaggle.com/andreshg/timeseries-analysis-a-complete-guide